Genetic screen of the yeast environmental stress response dynamics uncovers distinct regulatory phases
- PMID: 31464369
- PMCID: PMC6711295
- DOI: 10.15252/msb.20198939
Genetic screen of the yeast environmental stress response dynamics uncovers distinct regulatory phases
Abstract
Cells respond to environmental fluctuations by regulating multiple transcriptional programs. This response can be studied by measuring the effect of environmental changes on the transcriptome or the proteome of the cell at the end of the response. However, the dynamics of the response reflect the working of the regulatory mechanisms in action. Here, we utilized a fluorescent stress reporter gene to track the dynamics of protein production in yeast responding to environmental stress. The response is modulated by changes in both the duration and rate of transcription. We probed the underlying molecular pathways controlling these two dimensions using a library of ~1,600 single- and double-mutant strains. Dissection of the effects of these mutants and the interactions between them identified distinct modulators of response duration and response rate. Using a combination of mRNA-seq and live-cell microscopy, we uncover mechanisms by which Msn2/4, Mck1, Msn5, and the cAMP/PKA pathway modulate the response of a large module of stress-induced genes in two discrete regulatory phases. Our results and analysis show that transcriptional stress response is regulated by multiple mechanisms that overlap in time and cellular location.
Keywords: Msn2 and Msn4; budding yeast; dynamics of transcriptional response to stress; genetic interactions; signaling pathways.
© 2019 The Authors. Published under the terms of the CC BY 4.0 license.
Conflict of interest statement
The authors declare that they have no conflict of interest.
Figures
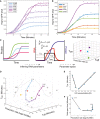
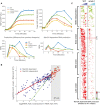
Hsp12‐GFP accumulation (y‐axis) versus time (x‐axis) in response to different levels of KCl stress. Points reflect the measured values, and lines correspond to best model fit.
Similar to (A), in different genetic backgrounds at 0.4 M KCl.
A scheme of parametric decomposition. (i) Start from protein abundance measurements in different time points following stress. (ii) Fit RNA parameters based on a simplified model for transient transcriptional response (Weiner et al, 2012) and (iii) compare different conditions/perturbations in parameter space.
Representation of the experiments shown in (B, C) in parameter space. Connected line shows the progression in the response to increasing KCl levels (see B).
The inferred t on parameter (y‐axis) versus KCl concentration (x‐axis) of the KCl gradient experiment (see B).
The inferred total open time – t off ‐ t on (y‐axis) versus the inferred production rate (x‐axis) of the KCl gradient experiment (see B).

Response of HSP12‐GFP to 0.4 M KCl on WT background. The x‐axis show the time after introduction of KCl and the y‐axis show the GFP levels (AU). Boxplots show the distribution of values in the populations measured at each time point (n > 2,500 cells per time point). Middle line 50% percentile, box 25–75% percentiles, whiskers show ± 1.5 inter‐quantile range (IQR, 75%–25% width) from box limits. Dots show outliers from the whisker range.
Effect of sparser time resolution on parameter estimation. For each of the time series in Fig 1A, we re‐estimated the parameters using only 7 equally spaced time points (out of 24). X‐axis—estimate using full data. Y‐axis—estimate using sparse data. Each point represents an estimate for a specific time series.
Robustness of parameter estimates to different levels of sparsity. Using the time series of 0.4 M KCl (Fig 1A), we randomly removed a number (x‐axis) of points from the data and re‐estimated the parameters. The boxplots showing the estimates of the parameters in 20 independent repeats of the procedure (boxes as in A). The dashed red line shows the parameter estimate from full data. Note the narrow range of estimated values for each parameter.
Total GFP produced (y‐axis) as a function of KCl concentration (x‐axis) from the experiment shown in Fig 1A. The total GFP parameter was estimated as the maximum of the curve.
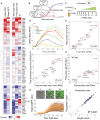
Summary of Hsp12‐GFP dynamics single‐mutant screen. Sixty‐eight mutants were divided into three groups: increased/decreased/did not change the total GFP produced. Each group was independently hierarchically clustered. The values shown are the Z‐scores of each parameter: t on —response onset time; production rate; total open time—length of transcriptional window (t off –t on); basal GFP—GFP levels measured before exposure to stress; delta GFP—amount of GFP produced throughout the experiment (max GFP ‐ basal GFP).
The dynamic parameters are regulated by partially independent mechanisms. Mutant strains can be roughly divided into three groups: affecting total open time, affecting production rate, and affecting both.
Outline of mRNA‐seq experiment. Sixteen yeast strains were grown to mid‐log phase, exposed to 0.4 M KCl, and sampled in the indicated time points after exposure to stress.
mRNA levels of HSP12 (y‐axis) as a function of time (x‐axis) in six representative strains.
Comparison of RNA levels to protein levels. X‐axis is the sum over the HSP12 mRNA counts (see D). Y‐axis is the maximum over the Hsp12‐GFP values. The red line indicates the best linear fit.
Comparing the total open time parameter inferred from mRNA data (x‐axis) to the one inferred from protein data (y‐axis). The red line indicates the best linear fit.
The same as (F) for the production/transcription rates. The red line indicates the best linear fit.
Time‐lapse microscopy of Hsp12‐GFP in response to stress (0.4 M KCl). Examples of raw images (top) and traces of individual cells (bottom). Traces are colored according to their basal GFP level.
Scatter plot showing the production rate estimated from single traces versus the production rate estimated from the population average. Each point represents a different yeast strain.

- A
Illustration of a potential artifact of a parameter estimation from the population mean. Shown is the simulation of GFP induction in single cells with exactly the same production rate and total open time, but different onset times. The red line shows the mean of the population at each time point. The parameters estimated from the population curve are different from the parameters of the individual curve (inset).
- B
Population mean of the individual traces shown in Fig 2H.
- C–E
Histogram of the T on parameter (C), the T off parameter (D), and the production rate parameter (E) derived from individual traces (Fig 2H). The orange dashed line marks the mean of the histogram, and the purple line marks the value of the parameter estimated from the population mean (B).
- F
Scatter plot showing the total open time estimated from single traces versus the total open time estimated from the population average. Each point represents a different yeast strain.

- A
Double‐mutant library, containing ˜1,600 strains with Hsp12‐GFP reporter, was screened using automated flow cytometry in six time points following exposure to stress (0.4 M KCl).
- B
Estimated parameters (median over repeats) of all ˜1,600 double‐mutant strains. The color represents the total Hsp12‐GFP produced. The same amount of GFP can be produced with multiple parameter combinations. The ellipses illustrate iso‐expression areas in the graph.
- C
Three examples of individual strains (marked in B) with nearly the same total expression but dramatically different dynamics.
- D
Illustration of the genetic interaction trends of individual mutants. For each single mutant, we plot the median of all the double mutants that contain it (purple dots). The gray dots are all individual double‐mutant strains (B).
- E, F
Illustration of the interactions of Δhog1 in the production rate parameter (E) and the total open time parameter (F). Shown the production rate of the single mutant (x‐axis) versus the production rate of the double mutant with Δhog1 (y‐axis). The gray line marks the Δhog1 single‐mutant levels. Points close to the gray line are ones where the value of the double mutant is close to the value of Δhog1 and defined as epistasis of Δhog1 (pink dots).
- G
Venn diagram comparing the number of epistatic pairs detected in various phenotypes.
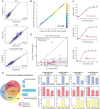
Reproducibility of the parameter estimation from the double‐mutant screen. Each point is a double‐mutant strain. The xy‐axis shows the results from two independent biological repeats.
For each data point collected in the screen (strain X time point X repeat), we plot the expected value according to the estimated parameters (y‐axis) versus the actual value (x‐axis).
Biological repeats of individual strains with the same total expression but different dynamics. As shown in Fig 3C.
Illustration of the interactions of Δhog1 in the total GFP parameter. Shown the total GFP of the single mutant (x‐axis) versus the total GFP of the double mutant with Δhog1 (y‐axis). The gray line marks the Hog1 single‐mutant levels. Points close to the gray line are ones where the value of the double mutant is close to the value of Δhog1 and defined as epistasis of Δhog1 (pink dots).
Venn diagram comparing the number of epistatic pairs detected in various phenotypes (left). For all pairs of mutants with 2 or more types of epistatic interactions, we plotted the fraction of pairs with incoherent interactions—where Δx is epistatic in one parameter and Δy in the other (center). Examples of epistatic interactions in different regions of the venn diagram. For each pair, the values of the single mutants and the double mutant are shown for each parameter. The color of the bars matches the colors in the venn diagram. Epistatic cases are marked with bold border (right).
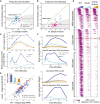
Epistatic interactions of Δmck1 in the production rate parameter (see Fig 3E).
Epistatic interactions of Δmck1 in the total open time parameter (see Fig 3E).
Upper: HSP12 mRNA in response to osmotic stress (0.4 M KCl). Lower: estimate of Msn2/4‐dependent production of HSP12 mRNA over time (difference between WT and Δmsn2Δmsn4 production profiles, Fig EV4A, Materials and Methods).
Δmck1 effect on the response of all stress genes. The integral over mRNA values in WT strain (x‐axis) versus the integral in the Δmck1 strain (Y values). The inset shows the integral for the HSP12 gene.
Heatmap showing expression of stress‐responsive genes in WT and two mutants over eight time points (see Fig 2C). Each gene is presented relative to its pre‐stress level and normalized by the median over WT values to visualize the dynamic range in all genes. The genes are separated into MSN‐dependent and MSN‐independent genes (Fig EV4B). The MSN‐dependent genes are sorted based on the onset time to three groups (early, average, and late onset).
The behavior of early‐ and late‐onset genes. Similar to (C) but showing the average over the genes in each group.
Estimation of Msn2/4‐dependent production of HSP12 gene. Top left panel shows HSP12‐GFP response in the different strains. Top right panel shows the normalized counts (PPM) of HSP12 mRNA molecules in response to osmotic stress in these strains (as in Fig 4C). Bottom left panel shows the change in RNA from previous time point as a proxy for RNA production during that period. Bottom right panel is the difference of each curve in the middle panel from Δmsn2Δmsn4 production. This value captures excess production beyond Msn2/4‐independent production and defined as Msn2/4‐dependent production.
The effect of Δmck1 on stress genes induction partially phenocopies the effect of Δmsn2Δmsn4. For each stress‐induced gene, we estimated the change in observed RNA in Δmsn2Δmsn4 (x‐axis) versus Δmck1 (y‐axis) when compared to WT. Genes that had little or no effect (ratio to WT > −0.5) of Δmsn2Δmsn4 are marked in red and defined as Msn2/4 independent.
Heatmap showing Msn2/4‐dependent production of stress‐responsive genes in WT and Δmck1 (in the same order as in Fig 4E).

Msn2‐GFP localization following stress (0.4 M KCl) in selected strains. Top: the percentage of nuclear cells (y‐axis) over time (x‐axis). Bottom: count of the number of nuclear import events in live‐cell time‐lapse microscopy at the two relevant periods.
Same data as in Fig 4C, with the addition of the Δmsn5 strain.
Same data as in Fig 4F, with the addition of the Δmsn5 strain.
Top: Schematic model of Msn2 localization in different genetic backgrounds and phases of the response. Bottom: summary of our observations in terms of nuclear localization, Msn2 activity, and the effect on gene expression.
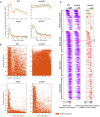
Biological repeats of Msn2‐GFP localization experiment (see Fig 5A).
Localization pattern in individual cell traces. Each row shows the in (orange)/out (white) nuclear localization pattern of an individual cell as a function of time (x‐axis) for the 4 strains.
Same as Figs 4E and EV4C, for Δmsn5 strain.
Similar articles
-
Noise and interlocking signaling pathways promote distinct transcription factor dynamics in response to different stresses.Mol Biol Cell. 2013 Jun;24(12):2045-57. doi: 10.1091/mbc.E12-12-0870. Epub 2013 Apr 24. Mol Biol Cell. 2013. PMID: 23615444 Free PMC article.
-
Fine-tuning of the Msn2/4-mediated yeast stress responses as revealed by systematic deletion of Msn2/4 partners.Mol Biol Cell. 2011 Sep;22(17):3127-38. doi: 10.1091/mbc.E10-12-1007. Epub 2011 Jul 14. Mol Biol Cell. 2011. PMID: 21757539 Free PMC article.
-
Control of nongenetic heterogeneity in growth rate and stress tolerance of Saccharomyces cerevisiae by cyclic AMP-regulated transcription factors.PLoS Genet. 2018 Nov 2;14(11):e1007744. doi: 10.1371/journal.pgen.1007744. eCollection 2018 Nov. PLoS Genet. 2018. PMID: 30388117 Free PMC article.
-
[Alternative ways of stress regulation in cells of Saccharomyces cerevisiae: transcriptional activators Msn2 and Msn4].Tsitologiia. 2009;51(3):271-8. Tsitologiia. 2009. PMID: 19435282 Review. Russian.
-
Novel sensing mechanisms and _targets for the cAMP-protein kinase A pathway in the yeast Saccharomyces cerevisiae.Mol Microbiol. 1999 Sep;33(5):904-18. doi: 10.1046/j.1365-2958.1999.01538.x. Mol Microbiol. 1999. PMID: 10476026 Review.
Cited by
-
Deletion of the Stress Response Gene DDR48 from Histoplasma capsulatum Increases Sensitivity to Oxidative Stress, Increases Susceptibility to Antifungals, and Decreases Fitness in Macrophages.J Fungi (Basel). 2021 Nov 18;7(11):981. doi: 10.3390/jof7110981. J Fungi (Basel). 2021. PMID: 34829268 Free PMC article.
-
Capturing and Understanding the Dynamics and Heterogeneity of Gene Expression in the Living Cell.Int J Mol Sci. 2020 Nov 5;21(21):8278. doi: 10.3390/ijms21218278. Int J Mol Sci. 2020. PMID: 33167354 Free PMC article. Review.
-
tRNAs as a Driving Force of Genome Evolution in Yeast.Front Microbiol. 2021 Mar 11;12:634004. doi: 10.3389/fmicb.2021.634004. eCollection 2021. Front Microbiol. 2021. PMID: 33776966 Free PMC article. Review.
-
Intrinsically disordered signaling proteins: Essential hub players in the control of stress responses in Saccharomyces cerevisiae.PLoS One. 2022 Mar 15;17(3):e0265422. doi: 10.1371/journal.pone.0265422. eCollection 2022. PLoS One. 2022. PMID: 35290420 Free PMC article.
-
The Yeast Protein Kinase Sch9 Functions as a Central Nutrient-Responsive Hub That Calibrates Metabolic and Stress-Related Responses.J Fungi (Basel). 2023 Jul 26;9(8):787. doi: 10.3390/jof9080787. J Fungi (Basel). 2023. PMID: 37623558 Free PMC article. Review.
References
-
- Alon U (2006) An introduction to systems biology: Design principles of biological circuits. Boca Raton, FL: CRC Press;
-
- Bahn Y‐S, Xue C, Idnurm A, Rutherford JC, Heitman J, Cardenas ME (2007) Sensing the environment: lessons from fungi. Nat Rev Microbiol 5: 57–69 - PubMed
-
- Bianchi MW, Plyte SE, Kreis M, Woodgett JR (1993) A Saccharomyces cerevisiae protein‐serine kinase related to mammalian glycogen synthase kinase‐3 and the Drosophila melanogaster gene shaggy product. Gene 134: 51–56 - PubMed
-
- Boy‐Marcotte E, Garmendia C, Garreau H, Lallet S, Mallet L, Jacquet M (2006) The transcriptional activation region of Msn2p, in Saccharomyces cerevisiae, is regulated by stress but is insensitive to the cAMP signalling pathway. Mol Genet Genomics 275: 277–287 - PubMed
Publication types
MeSH terms
Substances
Associated data
- Actions
Grants and funding
LinkOut - more resources
Full Text Sources
Molecular Biology Databases

