MFN1-dependent alteration of mitochondrial dynamics drives hepatocellular carcinoma metastasis by glucose metabolic reprogramming
- PMID: 31819189
- PMCID: PMC7052272
- DOI: 10.1038/s41416-019-0658-4
MFN1-dependent alteration of mitochondrial dynamics drives hepatocellular carcinoma metastasis by glucose metabolic reprogramming
Abstract
Background: Mitochondrial dynamics plays an important role in tumour progression. However, how these dynamics integrate tumour metabolism in hepatocellular carcinoma (HCC) metastasis is still unclear.
Methods: The mitochondrial fusion protein mitofusin-1 (MFN1) expression and its prognostic value are detected in HCC. The effects and underlying mechanisms of MFN1 on HCC metastasis and metabolic reprogramming are analysed both in vitro and in vivo.
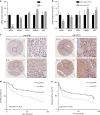
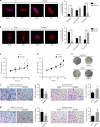
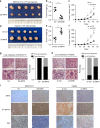
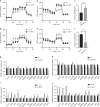
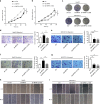
Results: Mitochondrial dynamics, represented by constant fission and fusion, are found to be associated with HCC metastasis. High metastatic HCC displays excessive mitochondrial fission. Among genes involved in mitochondrial dynamics, MFN1 is identified as a leading downregulated candidate that is closely associated with HCC metastasis and poor prognosis. While promoting mitochondrial fusion, MFN1 inhibits cell proliferation, invasion and migration capacity both in vitro and in vivo. Mechanistically, disruption of mitochondrial dynamics by depletion of MFN1 triggers the epithelial-to-mesenchymal transition (EMT) of HCC. Moreover, MFN1 modulates HCC metastasis by metabolic shift from aerobic glycolysis to oxidative phosphorylation. Treatment with glycolytic inhibitor 2-Deoxy-D-glucose (2-DG) significantly suppresses the effects induced by depletion of MFN1.
Conclusions: Our results reveal a critical involvement of mitochondrial dynamics in HCC metastasis via modulating glucose metabolic reprogramming. MFN1 may serve as a novel potential therapeutic _target for HCC.
Conflict of interest statement
The authors declare no competing interests.
Figures

Similar articles
-
Increased mitochondrial fission promotes autophagy and hepatocellular carcinoma cell survival through the ROS-modulated coordinated regulation of the NFKB and TP53 pathways.Autophagy. 2016 Jun 2;12(6):999-1014. doi: 10.1080/15548627.2016.1166318. Epub 2016 Apr 28. Autophagy. 2016. PMID: 27124102 Free PMC article.
-
MCUR1 facilitates epithelial-mesenchymal transition and metastasis via the mitochondrial calcium dependent ROS/Nrf2/Notch pathway in hepatocellular carcinoma.J Exp Clin Cancer Res. 2019 Mar 25;38(1):136. doi: 10.1186/s13046-019-1135-x. J Exp Clin Cancer Res. 2019. PMID: 30909929 Free PMC article.
-
FUNDC2 promotes liver tumorigenesis by inhibiting MFN1-mediated mitochondrial fusion.Nat Commun. 2022 Jun 17;13(1):3486. doi: 10.1038/s41467-022-31187-6. Nat Commun. 2022. PMID: 35710796 Free PMC article.
-
Reprogramming of glucose metabolism in hepatocellular carcinoma: Progress and prospects.World J Gastroenterol. 2016 Dec 7;22(45):9933-9943. doi: 10.3748/wjg.v22.i45.9933. World J Gastroenterol. 2016. PMID: 28018100 Free PMC article. Review.
-
Perspectives of Molecular Therapy-_targeted Mitochondrial Fission in Hepatocellular Carcinoma.Biomed Res Int. 2020 Dec 29;2020:1039312. doi: 10.1155/2020/1039312. eCollection 2020. Biomed Res Int. 2020. Retraction in: Biomed Res Int. 2024 Jan 9;2024:9856592. doi: 10.1155/2024/9856592 PMID: 33457401 Free PMC article. Retracted. Review.
Cited by
-
Association of mitochondrial homeostasis and dynamic balance with malignant biological behaviors of gastrointestinal cancer.J Transl Med. 2023 Jan 16;21(1):27. doi: 10.1186/s12967-023-03878-1. J Transl Med. 2023. PMID: 36647167 Free PMC article. Review.
-
m6A RNA methylation-mediated NDUFA4 promotes cell proliferation and metabolism in gastric cancer.Cell Death Dis. 2022 Aug 17;13(8):715. doi: 10.1038/s41419-022-05132-w. Cell Death Dis. 2022. PMID: 35977935 Free PMC article.
-
Hypoxia-induced ALDH3A1 promotes the proliferation of non-small-cell lung cancer by regulating energy metabolism reprogramming.Cell Death Dis. 2023 Sep 20;14(9):617. doi: 10.1038/s41419-023-06142-y. Cell Death Dis. 2023. PMID: 37730658 Free PMC article.
-
"The Loss of Golden Touch": Mitochondria-Organelle Interactions, Metabolism, and Cancer.Cells. 2020 Nov 21;9(11):2519. doi: 10.3390/cells9112519. Cells. 2020. PMID: 33233365 Free PMC article. Review.
-
Mitochondrial Dysfunction-Molecular Mechanisms and Potential Treatment approaches of Hepatocellular Carcinoma.Mol Cell Biochem. 2024 Oct 27. doi: 10.1007/s11010-024-05144-4. Online ahead of print. Mol Cell Biochem. 2024. PMID: 39463200 Review.
References
-
- Caruso S, Calatayud AL, Pilet J, La Bella T, Rekik S, Imbeaud S, et al. Analysis of liver cancer cell lines identifies agents with likely efficacy against hepatocellular carcinoma and markers of response. Gastroenterology. 2019;157:760–76.. - PubMed
Publication types
MeSH terms
Substances
Grants and funding
- 81672820/National Natural Science Foundation of China (National Science Foundation of China)/International
- 31722016/National Natural Science Foundation of China (National Science Foundation of China)/International
- 81930074/National Natural Science Foundation of China (National Science Foundation of China)/International
LinkOut - more resources
Full Text Sources
Medical

