. 2019 Dec 12;10(1):5674.
doi: 10.1038/s41467-019-13662-9.

Evolution of imprinting via lineage-specific insertion of retroviral promoters

Affiliations

Evolution of imprinting via lineage-specific insertion of retroviral promoters

Aaron B Bogutz et al. Nat Commun. .

Abstract

Imprinted genes are expressed from a single parental allele, with the other allele often silenced by DNA methylation (DNAme) established in the germline. While species-specific imprinted orthologues have been documented, the molecular mechanisms underlying the evolutionary switch from biallelic to imprinted expression are unknown. During mouse oogenesis, gametic differentially methylated regions (gDMRs) acquire DNAme in a transcription-guided manner. Here we show that oocyte transcription initiating in lineage-specific endogenous retroviruses (ERVs) is likely responsible for DNAme establishment at 4/6 mouse-specific and 17/110 human-specific imprinted gDMRs. The latter are divided into Catarrhini- or Hominoidea-specific gDMRs embedded within transcripts initiating in ERVs specific to these primate lineages. Strikingly, imprinting of the maternally methylated genes Impact and Slc38a4 was lost in the offspring of female mice harboring deletions of the relevant murine-specific ERVs upstream of these genes. Our work reveals an evolutionary mechanism whereby maternally silenced genes arise from biallelically expressed progenitors.


Conflict of interest statement

The authors declare no competing interests.

Figures
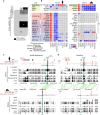
Fig. 1
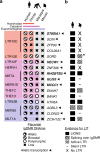
Fig. 1. Identification of human and mouse maternal igDMRs embedded within lineage-specific LITs.
a Venn diagram showing the intersection of known maternal igDMRs in mouse and human, along with the subset of igDMRs in each species embedded within a LIT. For each LIT-associated igDMR, the family of the LTR in which transcription initiates in oocytes is shown on the right. The presence of each LTR family in relevant mammalian lineages is color-coded as in Supplementary Fig. 1c. b List of imprinted genes/igDMRs associated with LITs. Maternal igDMRs unique to mouse (4) or human (17) are shown, along with DNAme levels (heat map) for each igDMR in syntenic regions in the gametes, blastocyst, placenta and adult tissues in human and mouse. The retrogene retro-Coro1c is absent in the syntenic human region on chromosome 6p22.3 (No orthologue). ZNF396 does not have a syntenic CGI in mice (No synteny). CT: cytotrophoblast; PBMC: peripheral blood mononuclear cell. c, d Screenshots of the human and mouse RHOBTB3/Rhobtb3 and SCIN/Scin loci, including locations of annotated genes, LTR retrotransposons, and regions of syntenic homology. The relevant CGI, igDMR, and upstream LTR in human are highlighted in green, blue, and red respectively. For each species, RNA-seq data from GVOs are shown, along with assembled transcripts, including LITs and their 5′ LTR exons (red) for the human genes. DNAme levels in gametes, blastocyst, placenta, and liver are shown across each locus in both species. For the human DNAme data, profiles from female 11-week primordial germs cells are also shown (11W PGC) and oocyte DNAme is from a mixture of GVO and MII oocytes. Details of all the datasets used in this study are presented in Supplementary Data 1.
Fig. 2
Fig. 2. Conservation of oocyte LTR-initiated transcription and gametic imprinting in primates.
a Table of 16 human genes with igDMRs embedded within LITs active in oocytes and showing maternal/allelic DNAme in blastocyst and cytotrophoblast. The family of the initiating LTR is shown on the left, color-coded according to the phylogenetic distribution of the ERV family (top), as in Fig. 1a. For each species, the presence of the LTR insertion at each locus is indicated by a matching colored box and the igDMR DNAme status in human or the syntenic region in chimp, macaque and mouse placenta is shown. An empty box indicates no data. Arrows indicate genes for which evidence of allelic transcription has been published (Supplementary Data 2). Gene names in bold were analyzed in greater detail. b Conservation of LITs in human and macaque oocytes for the 16 igDMRs from panel a. Solid boxes indicate LITs discovered by LIONS, boxed hatches indicate LITs with evidence of splicing from the LTR over the igDMR, and unboxed hatches indicate evidence of transcription from the LTR. Dashes indicate LTRs from which no transcription is seen, and loci for which the relevant LTR is absent from the macaque genome are also shown (X: No LTR). Asterisk denotes an LTR12F that may initiate a LIT in macaque oocytes (Supplementary Fig. 4b).
Fig. 3
Fig. 3. Chimp and macaque LITs and placental DNAme.
a Screenshot of the human ST8SIA1 locus, showing its CGI promoter (green), annotated gene (blue), oocyte LIT (red), and DNAme in human and macaque oocytes (black). Highlighted are the location of the upstream LTR12C in human and chimp (red) and the human igDMR (blue). b Screenshot of the human RHOBTB3 locus annotated as in a and highlighting the upstream MSTA LTR promoter (pink). c Violin plots of the distribution of mean DNAme levels per strand in placenta (chimp MCCC1: n = 2 all others: n = 3 biologically independent samples) for individual bisulphite-sequencing reads covering the igDMRs of the orthologous chimp and macaque ST8SIA1, HECW1, RHOBTB3, and MCCC1 genes. Coloured boxes indicate the presence of the proximal LTR. For each gene, the mean DNAme level at each of the CpGs surveyed is shown below. Symbols for DNAme are as in Fig. 2a. Note that the MER51E in the macaque MCCC1 locus is transcriptionally inert, likely due to macaque-specific SNPs rendering it transcriptionally inactive (Supplementary Fig. 4d–f). Source data are provided as a Source Data file. d Placental DNAme data at the HECW1, GLIS3, and MCCC1 loci for informative samples heterozygous at SNPs of known parental origin, are shown for the species indicated.
Fig. 4
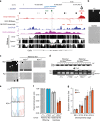
Fig. 4. Phylogenetic relationship between LTR, LIT, and maternal DNAme at mouse-specific igDMRs.
a The presence or absence of a LIT overlapping the CGI at Cdh15, Slc38a4, and Impact are indicated with closed boxes and dashes, respectively. X: species in which the LTR is absent. b Screenshots of Slc38a4/SLC38A4 and Impact/IMPACT loci showing GVO RNA-seq data (and the associated de novo Cufflinks transcript assembly), DNAme profiles in NGO, GVO and sperm, and H3K4me3, PolII, and H3K36me3 ChIP-seq tracks for mouse GVO. Highlighted are the upstream initiating LTR (red), CGI promoter (green), and mouse igDMR (blue). The syntenic region in human is also shown, including GVO RNA-seq and DNAme from oocytes and sperm. A 5′ RACE gene model initiating within the MTC element at the Impact locus is included in the right panel. c Scatter plot of oocyte H3K4me3 and transcription levels for all mouse MT2A elements, with those acting as transcription start sites in oocytes highlighted in blue. The remaining transcribed elements reflect exonization events. The MT2A element initiating the LIT at Slc38a4 (red) is amongst the most active elements of this family. d Histogram of the distribution of mouse MT2A LTRs as a function of divergence from the consensus sequence. The LTR driving expression at Slc38a4 is amongst the most highly diverged.
Fig. 5
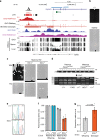
Fig. 5. Loss of imprinting at Slc38a4 upon maternal transmission of the MT2A KO allele.
a Genome-browser screenshot of the mouse Slc38a4 promoter and upstream region, including the MT2A LTR (red), annotated Slc38a4 exon 1, CGI (green), and igDMR (blue). GVO RNA-seq as well as RNA pol II, H3K4me3 and H3K36me3 ChIP-seq tracks are shown, along with DNAme data for GVO, sperm and adult liver. The region within the igDMR analyzed by sodium bisulfite sequencing (SBS), which includes 11 CpG sites, is shown at the bottom. Δ: extent of the MT2AKO deletion allele. b DNAme of the Slc38a4 igDMR in GVO from wild-type and Slc38a4MT2AKO/MT2AKO females determined by SBS. c DNAme of the Slc38a4 igDMR in E13.5 (Slc38a4+/MT2AKO × CAST)F1 embryos determined by SBS. Data for control (+/+C) and heterozygous (KO/+C) littermates with a maternally inherited MT2AKO are shown. +C: wild-type CAST allele; KO: Slc38a4MT2AKO. A polymorphic insertion in the amplified region allows for discrimination of maternal (Mat) and paternal (Pat) strands. Allele-specific expression analyses of F1 E13.5 placental RNA by d RT-PCR followed by PvuII RFLP analysis (RT reverse transcriptase), and e, f Sanger sequencing of a T ⟷ C transition in the 3′UTR of the Slc38a4 cDNA (maternal B6: T allele; and paternal CAST: C allele). Each bar in f shows the mean of individual samples, and error bars show S.D. of two SNPs analyzed. Source data are provided as a Source Data file. g Total Slc38a4 mRNA levels in E8.5, E13.5, E16.5, and E18.5 placentae, as determined by RT-qPCR (n = 6 biologically independent samples for each datapoint). Expression levels are relative to the housekeeping gene Ppia. Graph shows mean ± S.D. Source data are provided as a Source Data file.
Fig. 6
Fig. 6. Loss of imprinting at Impact upon maternal transmission of the MTC KO allele.
a Genome-browser screenshot of the mouse Impact locus, including the upstream MTC LTR (red), CGI (green), and igDMR (blue). GVO RNA-seq as well as RNA pol II, H3K4me3, and H3K36me3 ChIP-seq tracks are shown, along with DNAme data for GVO, sperm, and adult liver. The region within the igDMR analyzed by sodium bisulfite sequencing (SBS), which includes 10 CpG sites, is shown at the bottom. Δ: extent of the upstream MTCKO deletion allele. b DNAme of the Impact igDMR in GVO from wild-type and ImpactMTCKO/MTCKO females determined by SBS. c DNAme of the Impact igDMR in E13.5 (Impact+/MTCKO × CAST)F1 embryos determined by SBS. Data for control (+/+C) and heterozygous (KO/+C) littermates with a maternally inherited MTCKO are shown. +C: wild-type CAST allele; KO: ImpactMTCKO. A polymorphic insertion and a SNP in the amplified region allow for discrimination of maternal (Mat) and paternal (Pat) strands. d, e Allele-specific expression analysis of F1 E13.5 embryonic head RNA by d RT-PCR followed by MluCI RFLP analysis, and e Sanger sequencing of a A ⟷ G transition in the 3′UTR of the Impact mRNA (maternal B6: A allele; and paternal CAST: G allele). RT: reverse transcriptase. Source data are provided as a Source Data file. f Quantification of relative levels of expression from the paternal Impact allele based on the analysis of embryos as in e. Graph shows mean ± S.D of three SNPs. Source data are provided as a Source Data file. g Impact mRNA levels analyzed by RT-qPCR on E13.5 embryonic RNA (n = 6 biologically independent samples). Expression levels are relative to those for the wild-type allele. Graph shows mean ± S.E.M. Source data are provided as a Source Data file.

Similar articles

Cited by

References

    1. Stewart KR, et al. Dynamic changes in histone modifications precede de novo DNA methylation in oocytes. Genes Dev. 2015;29:2449–2462. doi: 10.1101/gad.271353.115. - DOI - PMC - PubMed
    1. Gahurova L, et al. Transcription and chromatin determinants of de novo DNA methylation timing in oocytes. Epigenetics Chromatin. 2017;10:25. doi: 10.1186/s13072-017-0133-5. - DOI - PMC - PubMed
    1. Veselovska L, et al. Deep sequencing and de novo assembly of the mouse oocyte transcriptome define the contribution of transcription to the DNA methylation landscape. Genome Biol. 2015;16:209. doi: 10.1186/s13059-015-0769-z. - DOI - PMC - PubMed
    1. Shirane K, et al. Mouse oocyte methylomes at base resolution reveal genome-wide accumulation of non-CpG methylation and role of DNA methyltransferases. PLoS Genet. 2013;9:e1003439. doi: 10.1371/journal.pgen.1003439. - DOI - PMC - PubMed
    1. Kobayashi H, et al. Contribution of intragenic DNA methylation in mouse gametic DNA methylomes to establish oocyte-specific heritable marks. PLoS Genet. 2012;8:e1002440. doi: 10.1371/journal.pgen.1002440. - DOI - PMC - PubMed

Publication types

Grants and funding

LinkOut - more resources

  NODES
Idea 1
idea 1
Note 2
Project 1
twitter 2