Review
. 2020 Mar:325:113144.
doi: 10.1016/j.expneurol.2019.113144. Epub 2019 Dec 16.

NAD+ precursor modulates post-ischemic mitochondrial fragmentation and reactive oxygen species generation via SIRT3 dependent mechanisms

Affiliations
Review

NAD+ precursor modulates post-ischemic mitochondrial fragmentation and reactive oxygen species generation via SIRT3 dependent mechanisms

Nina Klimova et al. Exp Neurol. 2020 Mar.

Abstract

Global cerebral ischemia depletes brain tissue NAD+, an essential cofactor for mitochondrial and cellular metabolism, leading to bioenergetics failure and cell death. The post-ischemic NAD+ levels can be replenished by the administration of nicotinamide mononucleotide (NMN), which serves as a precursor for NAD+ synthesis. We have shown that NMN administration shows dramatic protection against ischemic brain damage and inhibits post-ischemic hippocampal mitochondrial fragmentation. To understand the mechanism of NMN-induced modulation of mitochondrial dynamics and neuroprotection we used our transgenic mouse models that express mitochondria _targeted yellow fluorescent protein in neurons (mito-eYFP) and mice that carry knockout of mitochondrial NAD+-dependent deacetylase sirt3 gene (SIRT3KO). Following ischemic insult, the mitochondrial NAD+ levels were depleted leading to an increase in mitochondrial protein acetylation, high reactive oxygen species (ROS) production, and excessive mitochondrial fragmentation. Administration of a single dose of NMN normalized hippocampal mitochondria NAD+ pools, protein acetylation, and ROS levels. These changes were dependent on SIRT3 activity, which was confirmed using SIRT3KO mice. Ischemia induced increase in acetylation of the key mitochondrial antioxidant enzyme, superoxide dismutase 2 (SOD2) that resulted in inhibition of its activity. This was reversed after NMN treatment followed by reduction of ROS generation and suppression of mitochondrial fragmentation. Specifically, we found that the interaction of mitochondrial fission protein, pDrp1(S616), with neuronal mitochondria was inhibited in NMN treated ischemic mice. Our data thus provide a novel link between mitochondrial NAD+ metabolism, ROS production, and mitochondrial fragmentation. Using NMN to _target these mechanisms could represent a new therapeutic approach for treatment of acute brain injury and neurodegenerative diseases.

Keywords: Acetylation; Free radicals; Global cerebral ischemia; Mitochondria; Mitochondrial dynamics; NAD(+).


Figures

Fig. 1.
Fig. 1.
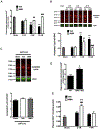
NMN administration reverses post-ischemic decline in hippocampal mitochondria NAD+ levels and induces SIRT3 mediated decrease in protein acetylation. (A) NAD+ levels were measured in isolated hippocampal mitochondria in sham operated and post-ischemic vehicle (PBS) or NMN (62.5 mg/kg) treated animals at 2, 4, and 24 h of recovery. NMN administration resulted in no significant change in mitochondrial NAD+ content following ischemia when compared to sham levels. *** p < .001 when compared to sham, ## p < .01 compared to 4 hR vehicle, ### p < .001 compared to 24 hR vehicle, two-way ANOVA followed by Tukey’s HSD test, n = 4–5 animals/group. (B) Mitochondrial protein acetylation changes were analyzed in post-ischemic vehicle and NMN treated animals. NMN normalized post-ischemic mitochondrial protein acetylation levels. *** p < .001 when compared to sham, # p < .05 when compared to corresponding vehicle treated animals, ### p < .001 when compared to corresponding vehicle treated animals, two-way ANOVA followed by Tukey’s HSD test, n = 6 animals/group. (C) Mitochondrial protein acetylation in SIRT3KO animals following ischemia in vehicle and NMN treated animals. Neither Ischemic insult nor NMN administration affected mitochondrial protein acetylation in SIRT3KO mitochondrial samples, one-way ANOVA followed by Tukey’s HSD test, n = 4 animals/group. (D) SIRT3KO mice show elevated levels of mitochondrial NAD+ when compared to wild-type (WT) mice. * p < .05, Student t-test, n = 4 animals/group. (E) NAD+ levels in plasma of post-ischemic animals injected with NMN. NMN was administered 30 min after the start of reperfusion. Blood was collected at 2 and 4 h of recovery. Plasma of NMN treated animals show an increase in NAD+ levels at 2 h of reperfusion that returned to normal physiologic levels 4 h after the start of recovery. ## p < .01 when compared to 2 hR vehicle. ** p < .01 when compared to sham, two-way ANOVA followed by Tukey’s HSD test, n = 4–5 animals/group.
Fig. 2.
Fig. 2.
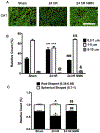
NMN administration leads to inhibition of ischemia-induced mitochondrial fragmentation in CA1 neurons. (A) Transgenic mice with neuron-specific expression of mitochondria _targeted enhanced yellow fluorescence protein (mito-eYFP) were subjected to 10 min of transient global cerebral ischemia. Thirty minutes after ischemia an intraperitoneal (i.p.) injection of vehicle (PBS) (24 hR) or NMN (24 hR NMN) was administered and animals were perfusion-fixed at 24 h of recovery. Mitochondria were visualized and their morphometric parameters measured in the hippocampal CA1 oriens. Mitochondria in NMN treated ischemic brain appeared less fragmented when compared to mitochondria in vehicle treated animals. Scale bar represents 100 μm. (B) Quantification of mitochondrial fragmentation. Following recording of z-stack images by confocal microscope the data were processed and analyzed by Volocity software. Mitochondria were divided into 3 populations based on their length (0.2–1 μm, 1–5 μm, and 5–15 μm). The relative distribution of individual mitochondria populations show that ischemic insult increases the number of short spherical mitochondria (0.2–1 μm) while decreasing the number of longer rod-shaped mitochondria (1–5 μm and 5–15 μm) when compared to sham. NMN treated ischemic animals did not display this shift in mitochondrial length population and retained physiological morphology. *** p < .001 compared to sham (0.2–1 μm); ### p < .001 compared to 24 hR (0.2–1 μm); ^^^ p < .001 compared to sham (1–5 μm); $ $ $ p < .001 compared to 24 hR (1–5 μm); @ p < .05 compared to sham (5–15 μm); & p < .05 compared to 24 hR (5–15 μm), one-way ANOVA followed by Tukey’s HSD test, n = 16 images/group. (C) Relative counts of mitochondria with shape factor (number one represents spherical shape and numbers close to 0 a rod-like elongated shape). Ischemic insult increased the population of spherical mitochondria compared to sham. NMN treated ischemic animals retained physiological levels of the mitochondrial shape factor. * p < .05 compared to sham (0.35–0.65); ## p < .01 compared to 24 hR (0.35–0.65); ^ p < .05 compared to sham (0.7–1); $ $ p < .01 compared to 24 hR (0.7–1), one-way ANOVA followed by Tukey’s HSD test, n = 16 images/group.
Fig. 3.
Fig. 3.
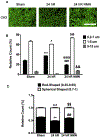
Ischemia-induced mitochondrial fission in CA3 neurons. CA3 neuronal mitochondria exhibit increased fragmentation after the ischemic insult that was reduced by NMN administration. (A) Mitochondria were visualized from the CA3 oriens in perfusion-fixed ischemic mito-eYFP mice treated with vehicle (PBS) (24 hR) or NMN (24 hR NMN). Mitochondria fragmented into spherical organelles at 24 h of recovery that was reversed after NMN treatment. Scale bar represents 100 μm. (B) The population of short mitochondria (0.2–1 μm) increased after ischemic insult while the longer population of mitochondria decreased (1–5 μm and 5–15 μm). NMN administration after ischemia inhibited the fragmentation process. *** p < .001 compared to sham (0.2–1 μm); ### p < .001 compared to 24 hR (0.2–1 μm); @@@ p < .001 compared to sham (0.2–1 μm); ^ p < .05 compared to sham (1–5 μm); $ $ $ p < .001 compared to 24 hR (1–5 μm); && p < .01 compared to 24 hR (5–15 μm), one-way ANOVA followed by Tukey’s HSD test, n = 16 images/group. (C) Mitochondrial shape factor changes. The population of spherical mitochondria (0.7–1) was elevated post-ischemia while rod-shaped mitochondria (0.35–0.65) decreased. NMN administration reversed these changes. ** p < .05 compared to sham (0.35–0.65); ## p < .01 compared to 24 hR (0.35–0.65); ^^p < .05 compared to sham (0.7–1); $$ p < .01 compared to 24 hR (0.7–1), one-way ANOVA followed by Tukey’s HSD test, n = 16 images/group.
Fig. 4.
Fig. 4.
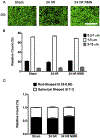
Dentate gyrus (DG) neuronal mitochondria are resistant to ischemic-induced fragmentation. (A) Mitochondria are visualized from the dorsal molecular layer of the DG in perfusion-fixed ischemic mito-eYFP mice treated with NMN (24 hR NMN) or vehicle (PBS) (24 hR). Scale bar represents 100 μm. Mitochondria did not show fragmentation after ischemic insult at 24 h of recovery. (B) Quantification of mitochondrial length using Volocity software. There were no changes in the population of 0.2–1, 1–5, 5–15 μm mitochondria after ischemic insult at 24 h of recovery with vehicle or NMN treatment compared to sham. One-way ANOVA followed by Tukey’s HSD test, n = 16 images/group. (C) The population of rod-shaped and spherical mitochondria measured by shape factor remained unchanged between experimental groups, one-way ANOVA followed by Tukey’s HSD test, n = 16 images/group.
Fig. 5.
Fig. 5.
NMN prevents post-ischemic increase in hippocampal pDrp1 (S616) protein levels. Ischemic groups were treated with vehicle (PBS) (Veh) or NMN and hippocampal tissue and mitochondria was isolated at 2, 4, and 24 h of reperfusion. Mitochondrial fusion and fission protein levels were measured by western blot and normalized using VDAC. (A) Mitofusin 1 (MFN1) levels increased after ischemic insult up to 24 h of recovery when compared to sham (2 hR - 2 h of recovery; 4 hR −4 h of recovery). At 24 h of recovery (24 hR) in both vehicle and NMN treated group the MFN1 levels we slightly lower when compared to 4 hR levels. (B) Mitofusin 2 (MFN2) levels were reduced after injury up to 24 h of recovery. (C) The ratio of OPA1 long (pro-fusion) to OPA1 short (pro-fission) levels was reduced after ischemia compared to sham. NMN treatment had no effect on ischemic-induced changes in mitochondrial fusion protein levels. (D) The phosphorylated form of mitochondrial fission protein, dynamin-1-like at serine 616 (pDrp1)(S616), increased at 24 h after injury while NMN treatment prevented this ischemia-induced change. (A) * p < .05, ** p < .01, *** p < .001 compared to sham; ^^ p < .01 compared to 4 hR NMN (B and C) *** p < .001 compared to sham (D) * p < .05 compared to sham; ^^ p < .01 compared to 24 hR vehicle, two-way ANOVA followed by Tukey’s HSD test, n = 6 animals/group.
Fig. 6.
Fig. 6.
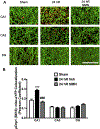
NMN administration prevents ischemic-induced trans-location of pDrp1 (S616) to the mitochondrial outer membrane in CA1 neurons. (A) Hippocampal brain sections from mito-eYFP transgenic animals were immunostained with pDrp1 (S616) antibody (red). Z-stack images were collected and the degree of colocalization of mitochondria (green) with pDrp1 (S616) was determine by the Pearson coefficient. (B) The Pearson coefficient was calculated by Volocity software in the CA1 oriens, CA3 oriens, and dorsal molecular layer of the DG. A significant increase in pDrp1 (S616) colocalization with mitochondria in the CA1 oriens was observed at 24 h of reperfusion when compared to sham. This change was prevented by NMN administration after ischemic insult. No changes were observed in pDrp1 (S616) colocalization with mitochondria in CA3 and DG neurons. Scale bar represents 100 μm. *** p < .001 compared to all other groups; ### p < .001 compared to CA1 24 hR vehicle, two-way ANOVA followed by Tukey’s HSD test, n = 16 images/group.
Fig. 7.
Fig. 7.
NMN administration inhibits the increase in hippocampal post-ischemic reactive oxygen species (ROS) generation. (A) SIRT3 _target, SOD2, was immunoprecipitated from sham operated, 24 hR, and 24 hR NMN hippocampal tissue samples and acetylation levels analyzed by western blot. There is a 30% increase in SOD2 acetylation post-ischemia, which was prevented by NMN administration. * p < .05 compared to sham, # p < .05 compared to 24 hR, one-way ANOVA followed by Tukey’s HSD test, n = 4 animals/group. (B) ROS indicator, dihydroethidium (DHE), was injected i.p. 10 min before start of ischemia and its’ fluorescent product, hydroxyethidium, was measured in hippocampal homogenate by plate reader. Fluorescence was normalized to total protein (represented here as fluorescence units/μg protein). ROS levels at early reperfusion (1 hR) were significantly increased compared to sham. *** p < .001 compared to sham, Student t-test, n = 9 measurements/group. (C) DHE was administered 1 h before the hippocampal tissue collection. At 2 h of reperfusion there was no difference in ROS production compared to sham. However, at 24 h of recovery there is a significant increase in ROS levels that was reduced by NMN administration. *** p < .001 compared to all groups; ### p < .001 compared to 24 hR vehicle, two-way ANOVA followed by Tukey’s HSD test, n = 6–8 animals/group. (D) The specific contribution of mitochondria and NADPH oxidase to ROS generation was examined by using mitochondria _targeted anti-oxidant, Mitoquinone (MitoQ), and NADPH oxidase inhibitor, Apocynin (Apo). ROS generation was measured via DHE administration. MitoQ and Apo suppressed ischemic-induced ROS production. *** p < .001 compared to sham; ^^^ p < .001 compared to 24 hR vehicle; # p < .05 compared to 24 hR vehicle, one-way ANOVA followed by Tukey’s HSD test, n = 5–6 animals/group.
Fig. 8.
Fig. 8.
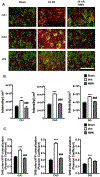
NMN treatment prevents ischemia-induced increase in mitochondrial ROS generation. (A) Hydroxyethidium fluorescence (red) following DHE administration in hippocampal CA1, CA3, DG neurons in sham operated, and post-ischemic animals treated with vehicle or NMN. Scale bar represents 100 μm. (B) NMN’s effects on post-ischemic changes in ROS generation were analyzed in various hippocampal subregions via quantification of the hydroxyethidium signal. ROS production significantly increases at 24 h of reperfusion in CA1, CA3, and DG. NMN treatment prevented the post-ischemic ROS increase in all areas. Fluorescence intensity was normalized to unit volume (μm3). (C) To confirm NMN effects were specifically affected mitochondrial ROS generation the Pearson colocalization coefficient between hydroxiethidium (red) and mito-eYFP (green) was determined by Volocity software. In all hippocampal subregions 24 h after the ischemic insult there is a significant increase in the colocalization between the oxidized DHE signal and mito-eYFP when compared to sham group. Administration of NMN prevented this increase in colocalization. *** p < .001 compared to sham; ### p < .001 compared to vehicle, one-way ANOVA followed by Tukey’s HSD test, n = 16 images/group.
Fig. 9.
Fig. 9.
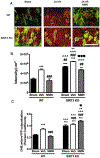
SIRT3 KO mice exhibit elevated ROS levels and are resistant to NMN-induced effects on post-ischemic free radicals generation. Mito-eYFP and mito-eYFP-SIRT3KO mice were injected with DHE 1 h before perfusion-fixation. (A) Hippocampal CA1 hydroxiethidium florescence (red) at 24 hours post-ischemia in WT and SIRT3 KO mice. Scale bar represents 100 μm. (B) ROS levels in sham operated SIRT3 KO mice are significantly higher compared to WT sham animals. Ischemia results in the rise in ROS in both WT and SIRT3 KO mice while NMN inhibits the ischemia-induced increase. Fluorescence intensity was normalized to unit volume. ** p < .01, *** p < .001 compared to WT Sham; ## p < .01, ### p < .001 compared to WT vehicle; ^^^ p < .001 compared to WT NMN; •• p < .01 compared to SIRT3KO Sham; ■■■ p < .001 compared to SIRT3 KO vehicle, two-way ANOVA followed by Tukey’s HSD test, n = 16 images/group. (C) To identify whether the source of ROS was mitochondrial we determined the Pearson colocalization coefficient between hydroxiethidium (red) signal and mito-eYFP (green) using Volocity software. Colocalization between oxidized DHE and mito-eYFP in SIRT3 KOs are significantly higher when compared to WT sham group. Ischemic-induced increase in the colocalization between hydroxiethidium and mito-eYFP is prevented by NMN in WT mice. However, NMN did not have any significant effect in SIRT3 KO animals. *** p < .001 compared to WT Sham; ### p < .001 compared to WT Vehicle; ^^^ p < .001 compared to WT NMN; •• p < .01 compared to SIRT3 KO Sham; ■ p < .05 compared to SIRT3 KO Vehicle, two-way ANOVA followed by Tukey’s HSD test, n = 16 images/group.
Fig. 10.
Fig. 10.
Post-ischemic ROS is generated in hippocampal pyramidal neurons and interneurons. Sham operated and ischemic animals were treated with DHE at 23 h of recovery and 1 h later they were perfusion fixed and their brain was processed for immunohistology. Neurons were identified by NeuN antibody, microglia were stained with Iba1 antibody, astrocyte were visualized by GFAP and S100β antibody, and finally interneurons were marked by GAD 65/67 or Parvalbumin antibody (all green). The hydroxiethidium signal (red) colocalized only with NeuN or interneuron markers.

Similar articles

Cited by

References

    1. Abramov AY, Scorziello A, Duchen MR, 2007. Three distinct mechanisms generate oxygen free radicals in neurons and contribute to cell death during anoxia and reoxygenation. J. Neurosci 27, 1129–1138. 10.1523/JNEUROSCI.4468-06.2007. - DOI - PMC - PubMed
    1. Ahmed E, Donovan T, Yujiao L, Zhang Q, 2015. Mitochondrial _targeted antioxidant in cerebral ischemia. J. Neurol. Neurosci 6. - PMC - PubMed
    1. Ahn BH, Kim HS, Song S, Lee IH, Liu J, Vassilopoulos A, Deng CX, Finkel T, 2008. A role for the mitochondrial deacetylase Sirt3 in regulating energy homeostasis. Proc. Natl. Acad. Sci. U. S. A 105, 14447–14452. 10.1073/pnas.0803790105. - DOI - PMC - PubMed
    1. Anand R, Wai T, Baker MJ, Kladt N, Schauss AC, Rugarli E, Langer T, 2014. The i-AAA protease YME1L and OMA1 cleave OPA1 to balance mitochondrial fusion and fission. J Cell Biol 204, 919–929. 10.1083/jcb.201308006. - DOI - PMC - PubMed
    1. Anderson KA, Hirschey MD, 2012. Mitochondrial protein acetylation regulates metabolism. Essays Biochem. 52, 23–35. 10.1042/bse0520023. - DOI - PMC - PubMed

Publication types

MeSH terms

  NODES
admin 29
INTERN 4
twitter 2