Genome-wide assessment of DNA methylation in mouse oocytes reveals effects associated with in vitro growth, superovulation, and sexual maturity
- PMID: 31856890
- PMCID: PMC6923880
- DOI: 10.1186/s13148-019-0794-y
Genome-wide assessment of DNA methylation in mouse oocytes reveals effects associated with in vitro growth, superovulation, and sexual maturity
Erratum in
-
Correction to: Genome-wide assessment of DNA methylation in mouse oocytes reveals effects associated with in vitro growth, superovulation, and sexual maturity.Clin Epigenetics. 2020 Jan 27;12(1):18. doi: 10.1186/s13148-020-0812-0. Clin Epigenetics. 2020. PMID: 31987054 Free PMC article.
Abstract
Background: In vitro follicle culture (IFC), as applied in the mouse system, allows the growth and maturation of a large number of immature preantral follicles to become mature and competent oocytes. In the human oncofertility clinic, there is increasing interest in developing this technique as an alternative to ovarian cortical tissue transplantation and to preserve the fertility of prepubertal cancer patients. However, the effect of IFC and hormonal stimulation on DNA methylation in the oocyte is not fully known, and there is legitimate concern over epigenetic abnormalities that could be induced by procedures applied during assisted reproductive technology (ART).
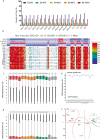
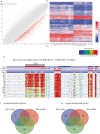
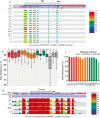
Results: In this study, we present the first genome-wide analysis of DNA methylation in MII oocytes obtained after natural ovulation, after IFC and after superovulation. We also performed a comparison between prepubertal and adult hormonally stimulated oocytes. Globally, the distinctive methylation landscape of oocytes, comprising alternating hyper- and hypomethylated domains, is preserved irrespective of the procedure. The conservation of methylation extends to the germline differential methylated regions (DMRs) of imprinted genes, necessary for their monoallelic expression in the embryo. However, we do detect specific, consistent, and coherent differences in DNA methylation in IFC oocytes, and between oocytes obtained after superovulation from prepubertal compared with sexually mature females. Several methylation differences span entire transcription units. Among these, we found alterations in Tcf4, Sox5, Zfp521, and other genes related to nervous system development.
Conclusions: Our observations show that IFC is associated with altered methylation at specific set of loci. DNA methylation of superovulated prepubertal oocytes differs from that of superovulated adult oocytes, whereas oocytes from superovulated adult females differ very little from naturally ovulated oocytes. Importantly, we show that regions other than imprinted gDMRs are susceptible to methylation changes associated with superovulation, IFC, and/or sexual immaturity in mouse oocytes. Our results provide an important reference for the use of in vitro growth and maturation of oocytes, particularly from prepubertal females, in assisted reproductive treatments or fertility preservation.
Keywords: Global DNA methylation; In vitro follicle culture; Prepubertal oocytes; Superovulation.
Conflict of interest statement
The authors declare that they have no competing interests.
Figures


Similar articles
-
The loss of imprinted DNA methylation in mouse blastocysts is inflicted to a similar extent by in vitro follicle culture and ovulation induction.Mol Hum Reprod. 2016 Jun;22(6):427-41. doi: 10.1093/molehr/gaw013. Epub 2016 Feb 7. Mol Hum Reprod. 2016. PMID: 26908643
-
Genome-wide assessment of DNA methylation alterations induced by superovulation, sexual immaturity and in vitro follicle growth in mouse blastocysts.Clin Epigenetics. 2023 Jan 16;15(1):9. doi: 10.1186/s13148-023-01421-z. Clin Epigenetics. 2023. PMID: 36647174 Free PMC article.
-
Single-cell DNA methylation sequencing reveals epigenetic alterations in mouse oocytes superovulated with different dosages of gonadotropins.Clin Epigenetics. 2020 Jun 1;12(1):75. doi: 10.1186/s13148-020-00866-w. Clin Epigenetics. 2020. PMID: 32487258 Free PMC article.
-
Culture of oocytes and risk of imprinting defects.Hum Reprod Update. 2013 Jan-Feb;19(1):52-66. doi: 10.1093/humupd/dms042. Epub 2012 Oct 10. Hum Reprod Update. 2013. PMID: 23054129 Review.
-
The effects of superovulation and reproductive aging on the epigenome of the oocyte and embryo.Mol Reprod Dev. 2018 Feb;85(2):90-105. doi: 10.1002/mrd.22951. Epub 2018 Jan 22. Mol Reprod Dev. 2018. PMID: 29280527 Review.
Cited by
-
Correction to: Genome-wide assessment of DNA methylation in mouse oocytes reveals effects associated with in vitro growth, superovulation, and sexual maturity.Clin Epigenetics. 2020 Jan 27;12(1):18. doi: 10.1186/s13148-020-0812-0. Clin Epigenetics. 2020. PMID: 31987054 Free PMC article.
-
Culture Medium and Sex Drive Epigenetic Reprogramming in Preimplantation Bovine Embryos.Int J Mol Sci. 2021 Jun 15;22(12):6426. doi: 10.3390/ijms22126426. Int J Mol Sci. 2021. PMID: 34204008 Free PMC article.
-
Effects of multisuperovulation on the transcription and genomic methylation of oocytes and offspring.Clin Epigenetics. 2024 Sep 28;16(1):135. doi: 10.1186/s13148-024-01746-3. Clin Epigenetics. 2024. PMID: 39342274 Free PMC article.
-
Increased transcriptome variation and localised DNA methylation changes in oocytes from aged mice revealed by parallel single-cell analysis.Aging Cell. 2020 Dec;19(12):e13278. doi: 10.1111/acel.13278. Epub 2020 Nov 17. Aging Cell. 2020. PMID: 33201571 Free PMC article.
-
Maternal loss-of-function of Nlrp2 results in failure of epigenetic reprogramming in mouse oocytes.Res Sq [Preprint]. 2024 Jun 4:rs.3.rs-4457414. doi: 10.21203/rs.3.rs-4457414/v1. Res Sq. 2024. PMID: 38883732 Free PMC article. Preprint.
References
-
- Sánchez F, Lolicato F, Romero S, De Vos M, Van Ranst H, Verheyen G, et al. An improved IVM method for cumulus-oocyte complexes from small follicles in polycystic ovary syndrome patients enhances oocyte competence and embryo yield. Hum Reprod. 2017;32:2056–2068. doi: 10.1093/humrep/dex262. - DOI - PubMed
Publication types
MeSH terms
Grants and funding
LinkOut - more resources
Full Text Sources
Medical

