Dysregulation of RNA Splicing in Tauopathies
- PMID: 31875547
- PMCID: PMC6941411
- DOI: 10.1016/j.celrep.2019.11.093
Dysregulation of RNA Splicing in Tauopathies
Abstract
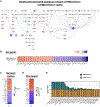
Pathological aggregation of RNA binding proteins (RBPs) is associated with dysregulation of RNA splicing in PS19 P301S tau transgenic mice and in Alzheimer's disease brain tissues. The dysregulated splicing particularly affects genes involved in synaptic transmission. The effects of neuroprotective TIA1 reduction on PS19 mice are also examined. TIA1 reduction reduces disease-linked alternative splicing events for the major synaptic mRNA transcripts examined, suggesting that normalization of RBP functions is associated with the neuroprotection. Use of the NetDecoder informatics algorithm identifies key upstream biological _targets, including MYC and EGFR, underlying the transcriptional and splicing changes in the protected compared to tauopathy mice. Pharmacological inhibition of MYC and EGFR activity in neuronal cultures tau recapitulates the neuroprotective effects of TIA1 reduction. These results demonstrate that dysfunction of RBPs and RNA splicing processes are major elements of the pathophysiology of tauopathies, as well as potential therapeutic _targets for tauopathies.
Keywords: EGFR; MYC; NetDecoder; RNA metabolism; RNA splicing; RNA-seq; TIA1; neuroprotection; stress granule; tauopathy; transcriptome.
Copyright © 2019 The Authors. Published by Elsevier Inc. All rights reserved.
Conflict of interest statement
DECLARATION OF INTERESTS
B.W. is co-founder and chief scientific officer of Aquinnah Pharmaceuticals Inc. D.J.A. is now an employee of Biogen Inc. The other authors declare no competing interests.
Figures


Similar articles
-
TIA1 regulates the generation and response to toxic tau oligomers.Acta Neuropathol. 2019 Feb;137(2):259-277. doi: 10.1007/s00401-018-1937-5. Epub 2018 Nov 21. Acta Neuropathol. 2019. PMID: 30465259 Free PMC article.
-
Reducing the RNA binding protein TIA1 protects against tau-mediated neurodegeneration in vivo.Nat Neurosci. 2018 Jan;21(1):72-80. doi: 10.1038/s41593-017-0022-z. Epub 2017 Nov 20. Nat Neurosci. 2018. PMID: 29273772 Free PMC article.
-
Interaction of tau with the RNA-Binding Protein TIA1 Regulates tau Pathophysiology and Toxicity.Cell Rep. 2016 May 17;15(7):1455-1466. doi: 10.1016/j.celrep.2016.04.045. Epub 2016 May 6. Cell Rep. 2016. PMID: 27160897 Free PMC article.
-
Tau alternative splicing in familial and sporadic tauopathies.Biochem Soc Trans. 2012 Aug;40(4):677-80. doi: 10.1042/BST20120091. Biochem Soc Trans. 2012. PMID: 22817715 Review.
-
Brain microRNAs dysregulation: Implication for missplicing and abnormal post-translational modifications of tau protein in Alzheimer's disease and related tauopathies.Pharmacol Res. 2020 May;155:104729. doi: 10.1016/j.phrs.2020.104729. Epub 2020 Feb 29. Pharmacol Res. 2020. PMID: 32126270 Review.
Cited by
-
The pathophysiology of neurodegenerative disease: Disturbing the balance between phase separation and irreversible aggregation.Prog Mol Biol Transl Sci. 2020;174:187-223. doi: 10.1016/bs.pmbts.2020.04.021. Epub 2020 May 12. Prog Mol Biol Transl Sci. 2020. PMID: 32828466 Free PMC article. Review.
-
ZCCHC17 Modulates Neuronal RNA Splicing and Supports Cognitive Resilience in Alzheimer's Disease.J Neurosci. 2024 Jan 17;44(3):e2324222023. doi: 10.1523/JNEUROSCI.2324-22.2023. J Neurosci. 2024. PMID: 38050142 Free PMC article.
-
Tau Isoforms: Gaining Insight into MAPT Alternative Splicing.Int J Mol Sci. 2022 Dec 6;23(23):15383. doi: 10.3390/ijms232315383. Int J Mol Sci. 2022. PMID: 36499709 Free PMC article. Review.
-
High content screening and proteomic analysis identify a kinase inhibitor that rescues pathological phenotypes in a patient-derived model of Parkinson's disease.NPJ Parkinsons Dis. 2022 Feb 11;8(1):15. doi: 10.1038/s41531-022-00278-y. NPJ Parkinsons Dis. 2022. PMID: 35149677 Free PMC article.
-
Proteostasis Deregulation in Neurodegeneration and Its Link with Stress Granules: Focus on the Scaffold and Ribosomal Protein RACK1.Cells. 2022 Aug 19;11(16):2590. doi: 10.3390/cells11162590. Cells. 2022. PMID: 36010666 Free PMC article. Review.
References
-
- Ahn K, Song JH, Kim DK, Park MH, Jo SA, and Koh YH (2009). Ubc9 gene polymorphisms and late-onset Alzheimer’s disease in the Korean population: a genetic association study. Neurosci. Lett 465, 272–275. - PubMed
-
- Anderson P, and Kedersha N (2008). Stress granules: the Tao of RNA triage. Trends Biochem. Sci 33, 141–150. - PubMed
-
- Arai T, Mackenzie IR, Hasegawa M, Nonoka T, Niizato K, Tsuchiya K, Iritani S, Onaya M, and Akiyama H (2009). Phosphorylated TDP-43 in Alzheimer’s disease and dementia with Lewy bodies. Acta Neuropathol 117, 125–136. - PubMed
Publication types
MeSH terms
Substances
Grants and funding
LinkOut - more resources
Full Text Sources
Molecular Biology Databases
Research Materials
Miscellaneous

