. 2020 Jan 3;10(1):77.
doi: 10.3390/biom10010077.

Lysosomal Fusion: An Efficient Mechanism Increasing Their Sequestration Capacity for Weak Base Drugs without Apparent Lysosomal Biogenesis

Affiliations

Lysosomal Fusion: An Efficient Mechanism Increasing Their Sequestration Capacity for Weak Base Drugs without Apparent Lysosomal Biogenesis

Nikola Skoupa et al. Biomolecules. .

Abstract

Lysosomal sequestration of anticancer therapeutics lowers their cytotoxic potential, reduces drug availability at _target sites, and contributes to cancer resistance. Only recently has it been shown that lysosomal sequestration of weak base drugs induces lysosomal biogenesis mediated by activation of transcription factor EB (TFEB) which, in turn, enhances their accumulation capacity, thereby increasing resistance to these drugs. Here, we addressed the question of whether lysosomal biogenesis is the only mechanism that increases lysosomal sequestration capacity. We found that lysosomal sequestration of some tyrosine kinase inhibitors (TKIs), gefitinib (GF) and imatinib (IM), induced expansion of the lysosomal compartment. However, an expression analysis of lysosomal genes, including lysosome-associated membrane proteins 1, 2 (LAMP1, LAMP2), vacuolar ATPase subunit B2 (ATP6V1B2), acid phosphatase (ACP), and galactosidase beta (GLB) controlled by TFEB, did not reveal increased expression. Instead, we found that both studied TKIs, GF and IM, induced lysosomal fusion which was dependent on nicotinic acid adenine dinucleotide phosphate (NAADP) mediated Ca2+signaling. A theoretical analysis revealed that lysosomal fusion is sufficient to explain the enlargement of lysosomal sequestration capacity. In conclusion, we demonstrated that extracellular TKIs, GF and IM, induced NAADP/Ca2+ mediated lysosomal fusion, leading to enlargement of the lysosomal compartment with significantly increased sequestration capacity for these drugs without apparent lysosomal biogenesis.

Keywords: Hl-60 cells; K562 cells; lysosomal fusion; lysosomal sequestration capacity; tyrosine kinase inhibitors.


Conflict of interest statement

The authors declare no conflict of interest.

Figures
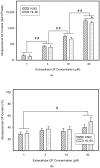
Figure 1
Figure 1
Lysosomal sequestration of tyrosine kinase inhibitors (TKIs). Absolute accumulation of TKI in lysosomes is expressed as molar amount of particular TKI in lysosomes per 106 cells. Relative accumulation of TKIs is calculated as the ratio: (intralysosomal accumulation of particular TKI/intracellular accumulation of particular TKI) × 100%. (a) Absolute accumulation of gefitinib (GF) in lysosomes of cancer cells. (b) Relative accumulation of GF in lysosomes of cancer cells. (c) Absolute accumulation of imatinib (IM) in lysosomes of cancer cells. (d) Relative accumulation of IM in lysosomes of cancer cells. The columns represent the means of four independent experiments with standard deviations. * denotes significant change in the intralysosomal GF or IM content (p < 0.05) between the K562 and HL-60 cells. # denotes significant change in the intralysosomal content of GF or IM (p < 0.05) between the indicated groups. ## denotes a very significant change in the intralysosomal content of GF or IM (p < 0.01) between the indicated groups.
Figure 1
Figure 1
Lysosomal sequestration of tyrosine kinase inhibitors (TKIs). Absolute accumulation of TKI in lysosomes is expressed as molar amount of particular TKI in lysosomes per 106 cells. Relative accumulation of TKIs is calculated as the ratio: (intralysosomal accumulation of particular TKI/intracellular accumulation of particular TKI) × 100%. (a) Absolute accumulation of gefitinib (GF) in lysosomes of cancer cells. (b) Relative accumulation of GF in lysosomes of cancer cells. (c) Absolute accumulation of imatinib (IM) in lysosomes of cancer cells. (d) Relative accumulation of IM in lysosomes of cancer cells. The columns represent the means of four independent experiments with standard deviations. * denotes significant change in the intralysosomal GF or IM content (p < 0.05) between the K562 and HL-60 cells. # denotes significant change in the intralysosomal content of GF or IM (p < 0.05) between the indicated groups. ## denotes a very significant change in the intralysosomal content of GF or IM (p < 0.01) between the indicated groups.
Figure 2
Figure 2
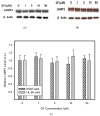
Effect of GF on expression of lysosomal proteins in cancer cells. Cells were cultured for 6 h in the presence of GF as indicated, prior to Western blot analysis. Cells cultured in medium without GF were taken as a control. (a) Western blot analysis of LAMP1 in K562 cells (typical analysis). (b) Western blot analysis of LAMP1 in HL-60 cells (typical analysis). (c) Quantitative analysis of LAMP1 expression using densitometry. (d) Western blot analysis of LAMP2 in K562 cells (typical analysis). (e) Western blot analysis of LAMP2 in HL-60 cells (typical analysis). (f) Quantitative analysis of LAMP2 expression using densitometry. (g) Western blot analysis of vacuolar ATPase subunit B2 in K562 cells (typical analysis). (h) Western blot analysis of vacuolar ATPase subunit B2 in HL-60 cells (typical analysis). (i) Quantitative analysis of vacuolar ATPase subunit B2 using densitometry. Results were normalized to β-actin. The results represent the means of four independent experiments with standard deviations.
Figure 2
Figure 2
Effect of GF on expression of lysosomal proteins in cancer cells. Cells were cultured for 6 h in the presence of GF as indicated, prior to Western blot analysis. Cells cultured in medium without GF were taken as a control. (a) Western blot analysis of LAMP1 in K562 cells (typical analysis). (b) Western blot analysis of LAMP1 in HL-60 cells (typical analysis). (c) Quantitative analysis of LAMP1 expression using densitometry. (d) Western blot analysis of LAMP2 in K562 cells (typical analysis). (e) Western blot analysis of LAMP2 in HL-60 cells (typical analysis). (f) Quantitative analysis of LAMP2 expression using densitometry. (g) Western blot analysis of vacuolar ATPase subunit B2 in K562 cells (typical analysis). (h) Western blot analysis of vacuolar ATPase subunit B2 in HL-60 cells (typical analysis). (i) Quantitative analysis of vacuolar ATPase subunit B2 using densitometry. Results were normalized to β-actin. The results represent the means of four independent experiments with standard deviations.
Figure 3
Figure 3
Effect of IM on expression of lysosomal proteins in cancer cells. Cells were cultured for 6 h in the presence of IM as indicated prior to Western blot analysis. Cells cultured in medium without IM were taken as a control. (a) Western blot analysis of LAMP1 in K562 cells (typical analysis). (b) Western blot analysis of LAMP1 in HL-60 cells (typical analysis). (c) Quantitative analysis of LAMP1 expression using densitometry. (d) Western blot analysis of LAMP2 in K562 cells (typical analysis). (e) Western blot analysis of LAMP2 in HL-60 cells (typical analysis). (f) Quantitative analysis of LAMP2 expression using densitometry. (g) Western blot analysis of vacuolar ATPase subunit B2 in K562 cells (typical analysis). (h) Western blot analysis of vacuolar ATPase subunit B2 in HL-60 cells (typical analysis). (i) Quantitative analysis of vacuolar ATPase subunit B2 using densitometry. Results were normalized to β-actin. The results represent the means of four independent experiments with standard deviations.
Figure 3
Figure 3
Effect of IM on expression of lysosomal proteins in cancer cells. Cells were cultured for 6 h in the presence of IM as indicated prior to Western blot analysis. Cells cultured in medium without IM were taken as a control. (a) Western blot analysis of LAMP1 in K562 cells (typical analysis). (b) Western blot analysis of LAMP1 in HL-60 cells (typical analysis). (c) Quantitative analysis of LAMP1 expression using densitometry. (d) Western blot analysis of LAMP2 in K562 cells (typical analysis). (e) Western blot analysis of LAMP2 in HL-60 cells (typical analysis). (f) Quantitative analysis of LAMP2 expression using densitometry. (g) Western blot analysis of vacuolar ATPase subunit B2 in K562 cells (typical analysis). (h) Western blot analysis of vacuolar ATPase subunit B2 in HL-60 cells (typical analysis). (i) Quantitative analysis of vacuolar ATPase subunit B2 using densitometry. Results were normalized to β-actin. The results represent the means of four independent experiments with standard deviations.
Figure 4
Figure 4
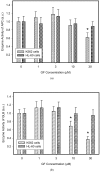
Effect of TKIs on activity of lysosomal hydrolases in cancer cells. Cells were cultured for 6 h in the presence of IM or GF as indicated and then enzymatic analysis of lysosomal hydrolases was done. Cells cultured in medium without TKIs were taken as a control. (a) Enzyme activity of lysosomal ACP in GF treated cells. (b) Enzyme activity of lysosomal GLB in GF treated cells. (c) Enzyme activity of lysosomal ACP in IM treated cells. (d) Enzyme activity of lysosomal GLB in IM treated cells. The columns represent the means of four independent experiments with standard deviations. * denotes significant change in the activity of lysosomal APC (or GLB) (p < 0.05) between TKI treated and control cells.
Figure 4
Figure 4
Effect of TKIs on activity of lysosomal hydrolases in cancer cells. Cells were cultured for 6 h in the presence of IM or GF as indicated and then enzymatic analysis of lysosomal hydrolases was done. Cells cultured in medium without TKIs were taken as a control. (a) Enzyme activity of lysosomal ACP in GF treated cells. (b) Enzyme activity of lysosomal GLB in GF treated cells. (c) Enzyme activity of lysosomal ACP in IM treated cells. (d) Enzyme activity of lysosomal GLB in IM treated cells. The columns represent the means of four independent experiments with standard deviations. * denotes significant change in the activity of lysosomal APC (or GLB) (p < 0.05) between TKI treated and control cells.
Figure 5
Figure 5
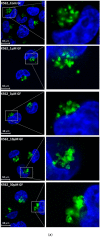
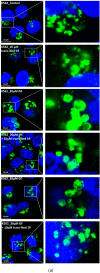
Effect of TKIs on lysosomal morphology in K562 cells. Cells were cultured for 6 h in the presence of particular TKI under standard conditions and then fixed in paraformaldehyde and subjected to the immunostaining of LAMP. Cells cultured in medium without TKIs were taken as a control. (a) Morphologic changes in lysosomes in IM treated cells (typical analysis). (b) Quantitative analysis of lysosomal size in IM treated cells. (c) Quantitative analysis of the number of lysosomes in IM treated cells. (d) Morphologic changes in lysosomes in GF treated cells (typical analysis). (e) Quantitative analysis of lysosomal size in GF treated cells. (f) Quantitative analysis of the number of lysosomes in GF treated cells. Lysosomal morphology was evaluated in at least 250 cells for each treatment. The results are represented as means of four independent experiments with standard deviations. ** denotes significant change in the relative number of lysosomes (p < 0.01) between TKI treated and control cells.
Figure 5
Figure 5
Effect of TKIs on lysosomal morphology in K562 cells. Cells were cultured for 6 h in the presence of particular TKI under standard conditions and then fixed in paraformaldehyde and subjected to the immunostaining of LAMP. Cells cultured in medium without TKIs were taken as a control. (a) Morphologic changes in lysosomes in IM treated cells (typical analysis). (b) Quantitative analysis of lysosomal size in IM treated cells. (c) Quantitative analysis of the number of lysosomes in IM treated cells. (d) Morphologic changes in lysosomes in GF treated cells (typical analysis). (e) Quantitative analysis of lysosomal size in GF treated cells. (f) Quantitative analysis of the number of lysosomes in GF treated cells. Lysosomal morphology was evaluated in at least 250 cells for each treatment. The results are represented as means of four independent experiments with standard deviations. ** denotes significant change in the relative number of lysosomes (p < 0.01) between TKI treated and control cells.
Figure 6
Figure 6
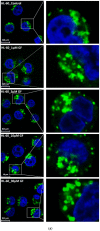
Effect of TKIs on lysosomal morphology in HL-60 cells. Cells were cultured for 6 h in the presence of particular TKI under standard conditions and then fixed in paraformaldehyde and subjected to the immunostaining of LAMP1. Cells cultured in medium without TKIs were taken as a control. (a) Morphologic changes in lysosomes in IM treated cells (typical analysis). (b) Quantitative analysis of lysosomal size in IM treated cells. (c) Quantitative analysis of the number of lysosomes in IM treated cells. (d) Morphologic changes in lysosomes in GF treated cells (typical analysis). (e) Quantitative analysis of lysosomal size in GF treated cells. (f) Quantitative analysis of the number of lysosomes in GF treated cells. Lysosomal morphology was evaluated in at least 250 cells for each treatment. The results are represented as means of four independent experiments with standard deviations. * denotes significant change in the relative number of lysosomes (p < 0.05) between TKI treated and control cells. ** denotes significant change in the relative number of lysosomes (p < 0.01) between TKI treated and control cells.
Figure 6
Figure 6
Effect of TKIs on lysosomal morphology in HL-60 cells. Cells were cultured for 6 h in the presence of particular TKI under standard conditions and then fixed in paraformaldehyde and subjected to the immunostaining of LAMP1. Cells cultured in medium without TKIs were taken as a control. (a) Morphologic changes in lysosomes in IM treated cells (typical analysis). (b) Quantitative analysis of lysosomal size in IM treated cells. (c) Quantitative analysis of the number of lysosomes in IM treated cells. (d) Morphologic changes in lysosomes in GF treated cells (typical analysis). (e) Quantitative analysis of lysosomal size in GF treated cells. (f) Quantitative analysis of the number of lysosomes in GF treated cells. Lysosomal morphology was evaluated in at least 250 cells for each treatment. The results are represented as means of four independent experiments with standard deviations. * denotes significant change in the relative number of lysosomes (p < 0.05) between TKI treated and control cells. ** denotes significant change in the relative number of lysosomes (p < 0.01) between TKI treated and control cells.
Figure 7
Figure 7
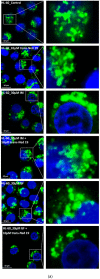
Effect of nicotinic acid adenine dinucleotide phosphate (NAADP) antagonist, trans-Ned 19, on lysosomal morphology in K562 cells treated with TKIs. Cells were cultured for 6 h in the presence of particular TKI with or without 10µM trans-Ned 19 under standard conditions and then fixed in paraformaldehyde and subjected to the immunostaining of LAMP1. Cells cultured in medium without TKIs were taken as a control. (a) Morphologic changes in lysosomes of K562 cells (typical analysis). (b) Quantitative analysis of lysosomal size in GF treated K562 cells. (c) Quantitative analysis of lysosomal size in IM treated K562 cells. Lysosomal morphology was evaluated in at least 250 cells for each treatment. The results are represented as means of four independent experiments with standard deviations. * denotes significant change in the number of lysosomes with size > 0.5µm (p < 0.05) between cells treated with TKI and cells treated with TKI + trans-Ned 19. ** denotes significant change in the number of lysosomes with size > 0.5µm (p < 0.01) between cells treated with TKI and cells treated with TKI + trans-Ned 19.
Figure 7
Figure 7
Effect of nicotinic acid adenine dinucleotide phosphate (NAADP) antagonist, trans-Ned 19, on lysosomal morphology in K562 cells treated with TKIs. Cells were cultured for 6 h in the presence of particular TKI with or without 10µM trans-Ned 19 under standard conditions and then fixed in paraformaldehyde and subjected to the immunostaining of LAMP1. Cells cultured in medium without TKIs were taken as a control. (a) Morphologic changes in lysosomes of K562 cells (typical analysis). (b) Quantitative analysis of lysosomal size in GF treated K562 cells. (c) Quantitative analysis of lysosomal size in IM treated K562 cells. Lysosomal morphology was evaluated in at least 250 cells for each treatment. The results are represented as means of four independent experiments with standard deviations. * denotes significant change in the number of lysosomes with size > 0.5µm (p < 0.05) between cells treated with TKI and cells treated with TKI + trans-Ned 19. ** denotes significant change in the number of lysosomes with size > 0.5µm (p < 0.01) between cells treated with TKI and cells treated with TKI + trans-Ned 19.
Figure 8
Figure 8
Effect of NAADP antagonist, trans-Ned 19, on lysosomal morphology in HL-60 cells treated with TKIs. Cells were cultured for 6 h in the presence of particular TKI with or without 10µM trans-Ned 19 under standard conditions and then fixed in paraformaldehyde and subjected to the immunostaining of LAMP1. Cells cultured in medium without TKIs were taken as a control. (a) Morphologic changes in lysosomes of HL-60 cells (typical analysis). (b) Quantitative analysis of lysosomal size in GF treated HL-60 cells. (c) Quantitative analysis of lysosomal size in IM treated HL-60 cells. Lysosomal morphology was evaluated in at least 250 cells for each treatment. Results are shown as means of four independent experiments with standard deviations. * denotes significant change in the number of lysosomes with size > 0.5µm (p < 0.05) between cells treated with TKI and cells treated with TKI + trans-Ned 19. ** denotes significant change in the number of lysosomes with size > 0.5µm (p < 0.01) between cells treated with TKI and cells treated with TKI + trans-Ned 19.
Figure 8
Figure 8
Effect of NAADP antagonist, trans-Ned 19, on lysosomal morphology in HL-60 cells treated with TKIs. Cells were cultured for 6 h in the presence of particular TKI with or without 10µM trans-Ned 19 under standard conditions and then fixed in paraformaldehyde and subjected to the immunostaining of LAMP1. Cells cultured in medium without TKIs were taken as a control. (a) Morphologic changes in lysosomes of HL-60 cells (typical analysis). (b) Quantitative analysis of lysosomal size in GF treated HL-60 cells. (c) Quantitative analysis of lysosomal size in IM treated HL-60 cells. Lysosomal morphology was evaluated in at least 250 cells for each treatment. Results are shown as means of four independent experiments with standard deviations. * denotes significant change in the number of lysosomes with size > 0.5µm (p < 0.05) between cells treated with TKI and cells treated with TKI + trans-Ned 19. ** denotes significant change in the number of lysosomes with size > 0.5µm (p < 0.01) between cells treated with TKI and cells treated with TKI + trans-Ned 19.
Figure 9
Figure 9
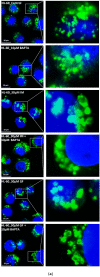
Effect of calcium chelator, BABTA-AM, on lysosomal morphology in K562 cells treated with TKIs. Cells were cultured for 6 h in the presence of particular TKI with or without 10µM BAPTA-AM under standard conditions and then fixed in paraformaldehyde and subjected to the immunostaining of LAMP1. Cells cultured in medium without TKIs were taken as a control. (a) Morphologic changes in lysosomes of K562 cells (typical analysis). (b) Quantitative analysis of lysosomal size in GF treated K562 cells. (c) Quantitative analysis of lysosomal size in IM treated K562 cells. Lysosomal morphology was evaluated in at least 250 cells for each treatment. The results are shown as means of four independent experiments with standard deviations. * denotes significant change in the number of lysosomes with size > 0.5µm (p < 0.05) between cells treated with TKI and cells treated with TKI + BAPTA-AM. ** denotes significant change in the number of lysosomes with size > 0.5µm (p < 0.01) between cells treated with TKI and cells treated with TKI + BAPTA-AM.
Figure 9
Figure 9
Effect of calcium chelator, BABTA-AM, on lysosomal morphology in K562 cells treated with TKIs. Cells were cultured for 6 h in the presence of particular TKI with or without 10µM BAPTA-AM under standard conditions and then fixed in paraformaldehyde and subjected to the immunostaining of LAMP1. Cells cultured in medium without TKIs were taken as a control. (a) Morphologic changes in lysosomes of K562 cells (typical analysis). (b) Quantitative analysis of lysosomal size in GF treated K562 cells. (c) Quantitative analysis of lysosomal size in IM treated K562 cells. Lysosomal morphology was evaluated in at least 250 cells for each treatment. The results are shown as means of four independent experiments with standard deviations. * denotes significant change in the number of lysosomes with size > 0.5µm (p < 0.05) between cells treated with TKI and cells treated with TKI + BAPTA-AM. ** denotes significant change in the number of lysosomes with size > 0.5µm (p < 0.01) between cells treated with TKI and cells treated with TKI + BAPTA-AM.
Figure 10
Figure 10
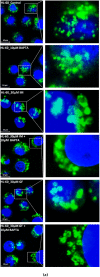
Effect of calcium chelator, BABTA-AM, on lysosomal morphology in HL-60 cells treated with TKIs. Cells were cultured for 6 h in the presence of particular TKI with or without 10 M BAPTA-AM under standard conditions and then fixed in paraformaldehyde and subjected to the immunostaining of LAMP1. Cells cultured in medium without TKIs were taken as a control. (a) Morphologic changes in lysosomes of HL-60 cells (typical analysis). (b) Quantitative analysis of lysosomal size in GF treated HL-60 cells. (c) Quantitative analysis of lysosomal size in IM treated HL-60 cells. Lysosomal morphology was evaluated in at least 250 cells for each treatment. The results are shown as means of four independent experiments with standard deviations. * denotes significant change in the number of lysosomes with size > 0.5 µm (p < 0.05) between cells treated with TKI and cells treated with TKI + BAPTA-AM. ** denotes significant change in the number of lysosomes with size > 0.5 µm (p < 0.01) between cells treated with TKI and cells treated with TKI + BAPTA-AM.
Figure 10
Figure 10
Effect of calcium chelator, BABTA-AM, on lysosomal morphology in HL-60 cells treated with TKIs. Cells were cultured for 6 h in the presence of particular TKI with or without 10 M BAPTA-AM under standard conditions and then fixed in paraformaldehyde and subjected to the immunostaining of LAMP1. Cells cultured in medium without TKIs were taken as a control. (a) Morphologic changes in lysosomes of HL-60 cells (typical analysis). (b) Quantitative analysis of lysosomal size in GF treated HL-60 cells. (c) Quantitative analysis of lysosomal size in IM treated HL-60 cells. Lysosomal morphology was evaluated in at least 250 cells for each treatment. The results are shown as means of four independent experiments with standard deviations. * denotes significant change in the number of lysosomes with size > 0.5 µm (p < 0.05) between cells treated with TKI and cells treated with TKI + BAPTA-AM. ** denotes significant change in the number of lysosomes with size > 0.5 µm (p < 0.01) between cells treated with TKI and cells treated with TKI + BAPTA-AM.
Figure 11
Figure 11
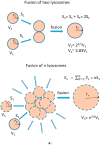
Lysosomal fusion and lysosomal volume. (a) Effect of lysosomal fusion on lysosomal volume. We consider a fusion of two lysosomes. For simplicity, they have the same size and they are spherical. Their lysosomal surface can be described by equation (I) and their volume by equation (II). S1 = 4πr12 (I), V1 = 4/3πr13 (II). The fusion of two lysosomes results in a new one whose membrane (surface) is formed by joining two membranes. The surface of the newly formed lysosome can be expressed by the equations (III and IV): S2 = 4πr22 (III), S2 = 2S1 = 8πr12 (IV). Combination III and IV gives: r2 = √2 r1 (V). The volume of the newly formed lysosome can be expressed by the equations: V2 = 4/3πr23 (VI). Combination V and VI gives: V2 = 4/3π23/2r13 → V2 = 2.83V1. In general, when considering fusion of n lysosomes in one, the following relationship between surface and volume can be established: Sn = 4πrn2, Sn = nS1 = n4πr12 → rn = √n r1, Vn = 4/3πrn3, Vn = 4/3πn3/2r13 → Vn = n3/2V1. (b) The functional relationship between the number of fusing lysosomes and resulting volume.
Figure 11
Figure 11
Lysosomal fusion and lysosomal volume. (a) Effect of lysosomal fusion on lysosomal volume. We consider a fusion of two lysosomes. For simplicity, they have the same size and they are spherical. Their lysosomal surface can be described by equation (I) and their volume by equation (II). S1 = 4πr12 (I), V1 = 4/3πr13 (II). The fusion of two lysosomes results in a new one whose membrane (surface) is formed by joining two membranes. The surface of the newly formed lysosome can be expressed by the equations (III and IV): S2 = 4πr22 (III), S2 = 2S1 = 8πr12 (IV). Combination III and IV gives: r2 = √2 r1 (V). The volume of the newly formed lysosome can be expressed by the equations: V2 = 4/3πr23 (VI). Combination V and VI gives: V2 = 4/3π23/2r13 → V2 = 2.83V1. In general, when considering fusion of n lysosomes in one, the following relationship between surface and volume can be established: Sn = 4πrn2, Sn = nS1 = n4πr12 → rn = √n r1, Vn = 4/3πrn3, Vn = 4/3πn3/2r13 → Vn = n3/2V1. (b) The functional relationship between the number of fusing lysosomes and resulting volume.

Similar articles

Cited by

References

    1. Appelmans F., Wattiaux R., De Duve C. Tissue fractionation studies. 5. The association of acid phosphatase with a special class of cytoplasmic granules in rat liver. Biochem. J. 1955;59:438–445. doi: 10.1042/bj0590438. - DOI - PMC - PubMed
    1. De Duve C. Lysosomes, a new group of cytoplasmic particles. In: Hayashi T., editor. Subcellular Particles. The Ronald Press Co.; New York, NY, USA: 1959. pp. 128–159.
    1. Saftig P., Klumperman J. Lysosome biogenesis and lysosomal membrane proteins: Trafficking meets function. Nat. Rev. Mol. Cell Biol. 2009;10:623–635. doi: 10.1038/nrm2745. - DOI - PubMed
    1. Lűllmann-Rauch R. History and morphology of the lysosome. In: Saftig P., editor. Lysosomes. Springer; New York, NY, USA: 2005.
    1. Boya P. Lysosomal function and dysfunction: Mechanism and disease. Antioxid. Redox Signal. 2012;17:766–774. doi: 10.1089/ars.2011.4405. - DOI - PubMed

Publication types

MeSH terms

Substances

LinkOut - more resources

  NODES
Association 1
INTERN 1
Note 36
twitter 2