. 2020 Jan 24;10(1):1136.
doi: 10.1038/s41598-020-58083-7.

Clonally selected primitive endothelial cells promote occlusive pulmonary arteriopathy and severe pulmonary hypertension in rats exposed to chronic hypoxia

Affiliations

Clonally selected primitive endothelial cells promote occlusive pulmonary arteriopathy and severe pulmonary hypertension in rats exposed to chronic hypoxia

Aneel R Bhagwani et al. Sci Rep. .

Abstract

One current concept suggests that unchecked proliferation of clonally selected precursors of endothelial cells (ECs) contribute to severe pulmonary arterial hypertension (PAH). We hypothesized that clonally selected ECs expressing the progenitor marker CD117 promote severe occlusive pulmonary hypertension (PH). The remodelled pulmonary arteries of PAH patients harboured CD117+ ECs. Rat lung CD117+ ECs underwent four generations of clonal expansion to enrich hyperproliferative ECs. The resulting clonally enriched ECs behaved like ECs, as measured by in vitro and in vivo angiogenesis assays. The same primitive ECs showed a limited ability for mesenchymal lineage differentiation. Endothelial differentiation and function were enhanced by blocking TGF-β signalling, promoting bone morphogenic protein (BMP) signalling. The transplantation of the EC clones caused arterio-occlusive PH in rats exposed to chronic hypoxia. These EC clones engrafted in the pulmonary arteries. Yet cessation of chronic hypoxia promoted lung cell apoptosis and resolution of vascular lesions. In conclusion, this is to the best of our knowledge, the first report that clonally enriched primitive ECs promote occlusive pulmonary arteriopathy and severe PH. These primitive EC clones further give rise to cells of endothelial and mesenchymal lineage as directed by BMP and TGF-β signaling.


Conflict of interest statement

M.K. declares grants from Prometic, grants and personal fees from Roche, Boehringer Ingelheim, GSK, Gilead, Actelion, Respivert, personal fees from Genoa, grants from Alkermes, grants from Pharmaxis, outside the submitted work. The other authors have no competing interests.

Figures
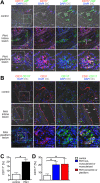
Figure 1
Figure 1
Localization of CD117+ ECs in PAH and control pulmonary arteries. (A,B) Representative pseudo coloured optical sections obtained by confocal microscopy and merged with differential interference contrast (DIC). (A) Occasional vWF+ cells (green pseudo colour) with less intense CD117 staining (red pseudo colour) were detected in the endothelial layer of pulmonary arteries from control subjects, whereas pulmonary arteries with intima lesions and particularly with plexiform lesions had substantial amounts of CD117+ vWF+ cells. (B) Similarly, CD117+ (green pseudo colour) CD31+ (red pseudo colour) cells were rare in the intima of pulmonary arteries of controls subjects, whereas multiple CD117+ CD31+ cells were found in pulmonary arteries from PAH patients (arrows). In control subjects, occasional CD117+ CD31+ cells were detected among the alveolar capillary cells (arrow). In (A,B), the image on the left shows an overview, and the images on the right demonstrate the area indicated with a dotted square in more detail. Scale bars: 50 μm (overview), 25 μm (detail). Counterstaining with DAPI (blue pseudo colour). (C,D) Quantification of CD117+ cells in pulmonary arteries of control subjects and PAH patients, in (C) summary of all pulmonary arteries is shown for each group, whereas (D) differentiates between non-muscularized/muscularized pulmonary arteries and pulmonary arteries with concentric or plexiform lesions in PAH patients. Note that total CD117+ cells and not CD117+ ECs were quantified. n = 3 (control), 6 (PAH). *P < 0.05.
Figure 2
Figure 2
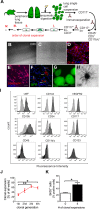
Isolation and characterization of EC clones from CD117+ ECs. (A) Isolation and clonal enrichment flow diagram for EC clones from the lungs of EGFP+ rats. (B) Representative differential interference contrast (DIC) image shows the typical endothelial cobblestone morphology of EC clones. (C) Representative DIC image of 2D matrigel assay. (D) Representative optical section (confocal microscopy) demonstrate binding of Griffonia simplicifolia lectin (red pseudo colour) in EC clones, indicating a microvascular phenotype (scale bar 25 μm). (E) 24 h 3D tube formation assay in fibrin shows formation of tube networks by EC clones (scale bar 200 μm). Cells were visualized by phalloidin staining of actin filaments (red pseudo colour). (F) confocal imaging of Matrigel plug at day 14 with EC clones stained for GFP (green pseudo colour) demonstrating GFP+ blood vessels. The red autofluorescence demonstrates blood and indicates active perfusion of the GFP+ vascular structures after 14 days. Scale bar: 25 μm. Counterstaining in (DF) with DAPI. (G,H) Representative images demonstrate that EC clones form free-floating spheroids in low adhesion cell culture wells. When overlaid with a 50Vol%/50Vol% EGM2/Matrigel mixture, EC clone spheroids underwent angiogenic sprouting. The image (G) shows green fluorescence channel of EC clone spheroids (green pseudo colour), whereas image (H) shows DIC brightfield image of an EC clone spheroid after 7 days of sprouting. Scale bars: 50 μm. (I) Representative flow cytometry analysis of EC clones shows expression of endothelial markers (vWF, CD144, VEGFR2, CD105, CD34) and CD117, but not of typical hematopoietic and myeloid markers (CD45, CD11b/c and CD133). Note that vWF is an intracellular marker and required permeabilization of the cells during the staining process. (J) The fraction of clonally expandable wells increases from clonal generation 1 to 3. n = 3 (1st) and 6 (2nd, 3rd, 4th). (K) 4th generation EC clones proliferate faster than non-expanded CD117+ ECs (n = 3–4). *P < 0.05, **P < 0.01.
Figure 3
Figure 3
Transformation of EC clones to smooth muscle-like cells and angiogenic effect of ALK5 inhibition. (A) Representative software-stitched images of 24 h of 2D Matrigel assay (growth factor-reduced Matrigel) after 3 days of culture of EC clones in EGM-2MV, SmGM2 and SmGM2+SB431542 (10 μM). The ALK5 inhibitor SB431542 promoted tube formation. Scale bar: 500 μm. (B) Quantification of total tube length in EC clones grown in EGM-2MV, SmGM2 and SmGM2+SB431542. n = 5–6 per group (C) qRT-PCR for Serpine1 demonstrates inhibition of TGF-β pathway using SB431542. n = 7–8 per group. (D) Representative DIC images of spheroids sprouted for 72 h in a 50% Matrigel/50% growth media mixture for EGM-2MV, SmGM2 and SmGM2+SB431542 groups. The dotted lines demonstrate the boundaries of the sprouting area used for quantification. Scale bar: 200 μm. (E) Sprouting area for EGM-2MV, SmGM2 and SmGM2+SB431542 groups. N = 5–7 per group (F) Gene expression profile indicates increased expression of mesenchymal markers and mesenchymal transition transcription factors in SmGM2 medium, which is prevented by SB431542. n = 3 per group. *P < 0.05, **P < 0.01, ***P < 0.001. (G) Representative Western blot analysis of phospho(P)-Smad2, BMPR2 and P-Smad1/5/9 in EC clones cultured in EGM-2MV, SmGM2 and SmGM2+SB411542. β-actin was used as loading control.
Figure 4
Figure 4
Transcriptome of EC clones vs. control ECs. Volcano plot of microarray data from 3 control ECs (ECs isolated from the CD117 cell pool) and 4 EC clones show categorical differences of gene expression in 468 genes (P < 0.05 with FDR, fold change >10) between the two groups. This plot shows the correlation between fold change of expression of CD117+ EC clones vs. CD117 ECs (x-axis) and P-value (y-axis), summarizing that many categorical differences were observed between the two cell populations in terms of significant up- and downregulation. The following specific gene _targets have been labelled in the Vulcano plot: Bmp2, Bmpr2, Il6, Id1. In addition, the blue horizontal line shows the cut-off for the P value.
Figure 5
Figure 5
Transplantation of EC clones promotes reversible occlusive pulmonary arteriopathy and severe PH in rats exposed to chronic hypoxia. (A) Representative images of immunohistochemistry (IHC) for vWF and α-SMA (brown staining) demonstrating occlusive pulmonary artery remodelling in hypoxic rats that received EC clones (occlusion with vWF+ cells, arrows), but not in CD117 EC transplanted rats (upper panel). Images show overview image obtained at 100× magnification and high-power images of representative pulmonary arteries (400× or 600× magnification). For the “chronic hypoxia 21 days + CD117+ EC clones” group, examples of occlusive vascular lesions are shown in high-power images at 600× magnification. In the low-power images, arrows indicate pulmonary arteries exhibiting occlusive lesions. In the high-power images, black arrowheads indicate multiple vascular channels within a pulmonary arterial lesion, and the white arrowheads indicate vWF+ cells occluding a pulmonary artery. Note the occlusion is cellular as demonstrated by haematoxylin+ cell nuclei (arrowheads). Some occluding cells were also α-SMA+(white arrows, lower panel). 21 days after cessation of cHx, the vascular changes were almost completely resolved (lower panel), except for elevated media wall thickness (MWT). Scale bars: 100 μm (low power), 25 μm (high power). (B) RVSP and (C) Fulton index. (D) MWT expressed as fraction of external diameter (ED). (E) Fraction of completely occluded pulmonary arteries. Scatter plots show single data points, mean and SEM. n = 3 (hypoxia, hypoxia+CD117 EC), n = 6 (EC clones). *P < 0.05, ***P < 0.001. (F) Representative Western blot demonstrates time course of caspase 3 cleavage in the lung tissue of rats treated with EC clones, followed by 21 days of chronic hypoxia (cHx), 21 days of cHx and 7 days of normoxia (Nx), and 21 days of cHx and 21 days of Nx. The data indicate a progressive increase in the expression of cleaved caspase-3 in the lung tissue of EC clones + cHx rats after cessation of cHx. β-actin was used as loading control.
Figure 6
Figure 6
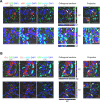
Confocal imaging of cell transplantation experiments. (A,B) Representative pseudo coloured optical sections obtained by confocal microscopy for immunofluorescence staining for GFP (green pseudocolour), α-SMA (cyan pseudocolour) and VWF (red pseudocolour) (A) and Griffonia simplicifolia lectin (G.s., red pseudolour), GFP (green pseudocolour) and α-SMA (cyan pseudocolour) (B) shows multiple vWF+ GFP+ cells (arrows) and VWF+ GFP+ αSMA+ cells (arrowhead), indicating EnMT, as well as G.s.+ GFP+ (arrows), G.s.+ GFP+ α-SMA+ (arrowheads) cells in and around the vascular lesions. GFP+ cells are derived from the transplanted EC clones at 21 days in hypoxia + EC clones. The findings of GFP+ cells in the lung vasculature 21 days after injection suggests engraftment of the EC clones. The images show the optical sections, orthogonal sections of Z-stacks and sum projection of the Z-stacks. Inserts in projection images show GFP+ EC or GFP+ EnMT cells in more detail. Nuclear staining with DAPI (blue pseudocolour), scale bar: 20 μm.
Figure 7
Figure 7
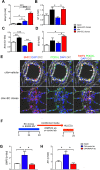
Lung tissue expression of genes with relevance to BMP pathway, inflammation and PAH pathogenesis after transplantation of EC clones. mRNA expression (qRT-PCR) of (A) Bmp2, (B) Id1, (C) Bmpr2, (D) Il6 after EC clone transplantation compared with chronic hypoxia or normoxia and vehicle. n = 3 per group. (E) Localization of BMP2+ PODXL+ cells (BMP2+ ECs) in the pulmonary arteries of cHx+vehicle and cHx+EC clones rats. BMP2 is shown in red pseudocolour, and PODXL is shown in green pseudocolour. Whereas normal rat lung contains multiple BMP2+ ECs (one representative cell is indicated by an arrow) and multiple BMP2 ECs, accumulation of BMP2+ ECs is vastly increased in cHx + EC clones rats, and multiple BMP2+ ECs are found in occlusive pulmonary arterial lesions (arrows). This staining includes no GFP stained cells and only demonstrates the increase in BMP2+ ECs after EC clone transplantation. Scale bar: 25 μm. Nuclear staining with DAPI (blue pseudocolour). (F) Diagram of the experimental approach for in vitro experiments. First, rat CD117+ EC clones were cultured for 48 h in EGM-2MV medium. Then, this conditioned media (CM) was transferred after addition of anti-BMP2/4 antibody (ab) or control ab to HULECs. After 24 h, HULECs were removed for gene expression analysis. (G,H) mRNA expression of BMP2 (G), and ID1 (H) in HULECs after 24 h exposure to media conditioned for 48 h by rat lung CD117+ EC clones. n = 9–12 per group. *P < 0.05, **P < 0.01, ***P < 0.001.

Similar articles

Cited by

References

    1. Sakao S, et al. VEGF-R blockade causes endothelial cell apoptosis, expansion of surviving CD34+ precursor cells and transdifferentiation to smooth muscle-like and neuronal-like cells. Faseb J. 2007;21:3640–3652. doi: 10.1096/fj.07-8432com. - DOI - PubMed
    1. Sakao S, et al. Initial apoptosis is followed by increased proliferation of apoptosis-resistant endothelial cells. Faseb J. 2005;19:1178–1180. doi: 10.1096/fj.04-3261fje. - DOI - PubMed
    1. Masri FA, et al. Hyperproliferative apoptosis-resistant endothelial cells in idiopathic pulmonary arterial hypertension. Am. J. Physiol. Lung Cell Mol. Physiol. 2007;293:L548–54. doi: 10.1152/ajplung.00428.2006. - DOI - PubMed
    1. Lee G, et al. Single Microfluidic Electrochemical Sensor System for Simultaneous Multi-Pulmonary Hypertension Biomarker Analyses. Sci. Rep. 2017;7:7545. doi: 10.1038/s41598-017-06144-9. - DOI - PMC - PubMed
    1. Montani D, et al. C-kit-positive cells accumulate in remodeled vessels of idiopathic pulmonary arterial hypertension. Am. J. Respir. Crit. Care Med. 2011;184:116–123. doi: 10.1164/rccm.201006-0905OC. - DOI - PubMed

Publication types

MeSH terms

Substances

  NODES
INTERN 8
Note 3
Project 2
twitter 2