Measuring the Microscopic Structures of Human Dental Enamel Can Predict Caries Experience
- PMID: 32024259
- PMCID: PMC7151622
- DOI: 10.3390/jpm10010005
Measuring the Microscopic Structures of Human Dental Enamel Can Predict Caries Experience
Abstract
Objectives: The hierarchical structure of enamel gives insight on the properties of enamel and can influence its strength and ultimately caries experience. Currently, past caries experience is quantified using the decayed, missing, filled teeth/decayed, missing, filled surface (DMFT/DMFS for permanent teeth; dmft/dmfs for primary teeth), or international caries detection and assessment system (ICDAS) scores. By analyzing the structure of enamel, a new measurement can be utilized clinically to predict susceptibility to future caries experience based on a patient's individual's biomarkers. The purpose of this study was to test the hypothesis that number of prisms by square millimeter in enamel and average gap distance between prisms and interprismatic areas, influence caries experience through genetic variation of the genes involved in enamel formation.
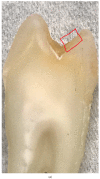
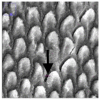
Materials and methods: Scanning electron microscopy (SEM) images of enamel from primary teeth were used to measure (i) number of prisms by square millimeter and interprismatic spaces, (ii) prism density, and (iii) gap distances between prisms in the enamel samples. The measurements were tested to explore a genetic association with variants of selected genes and correlations with caries experience based on the individual's DMFT+ dmft score and enamel microhardness at baseline, after an artificial lesion was created and after the artificial lesion was treated with fluoride.
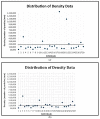
Results: Associations were found between variants of genes including ameloblastin, amelogenin, enamelin, tuftelin, tuftelin interactive protein 11, beta defensin 1, matrix metallopeptidase 20 and enamel structure variables measured (number of prisms by square millimeter in enamel and average gap distance between prisms and interprismatic areas). Significant correlations were found between caries experience and microhardness and enamel structure. Negative correlations were found between number of prisms by square millimeter and high caries experience (r value= -0.71), gap distance between prisms and the enamel microhardness after an artificial lesion was created (r value= -0.70), and gap distance between prisms and the enamel microhardness after an artificial lesion was created and then treated with fluoride (r value= -0.81). There was a positive correlation between number of prisms by square millimeter and prism density of the enamel (r value = 0.82).
Conclusions: Our data support that genetic variation may impact enamel formation, and therefore influence susceptibility to dental caries and future caries experience.
Clinical relevance: The evaluation of enamel structure that may impact caries experience allows for hypothesizing that the identification of individuals at higher risk for dental caries and implementation of personalized preventative treatments may one day become a reality.
Keywords: amelogenesis; dental caries; dental enamel; genetics; polymorphism.
Conflict of interest statement
The authors declare no conflict of interest.
Figures


Similar articles
-
Genetic influences on dental enamel that impact caries differ between the primary and permanent dentitions.Eur J Oral Sci. 2015 Oct;123(5):327-334. doi: 10.1111/eos.12204. Epub 2015 Aug 18. Eur J Oral Sci. 2015. PMID: 26283008 Free PMC article.
-
Enamel formation genes are associated with high caries experience in Turkish children.Caries Res. 2008;42(5):394-400. doi: 10.1159/000154785. Epub 2008 Sep 10. Caries Res. 2008. PMID: 18781068 Free PMC article.
-
Enamel formation genes influence enamel microhardness before and after cariogenic challenge.PLoS One. 2012;7(9):e45022. doi: 10.1371/journal.pone.0045022. Epub 2012 Sep 24. PLoS One. 2012. PMID: 23028741 Free PMC article.
-
Slow-release fluoride devices for the control of dental decay.Cochrane Database Syst Rev. 2014 Nov 28;(11):CD005101. doi: 10.1002/14651858.CD005101.pub3. Cochrane Database Syst Rev. 2014. Update in: Cochrane Database Syst Rev. 2018 Mar 01;3:CD005101. doi: 10.1002/14651858.CD005101.pub4 PMID: 25432017 Updated. Review.
-
Prevalence of dental caries and enamel defects in children living in areas with different water fluoride concentrations.Community Dent Health. 1990 Sep;7(3):229-36. Community Dent Health. 1990. PMID: 2076499 Review.
Cited by
-
Associations of PART1 and DEFB1 polymorphisms with Dental Caries in twelve-year-old children in Southern China: a cross-sectional study.BMC Pediatr. 2023 Jan 4;23(1):6. doi: 10.1186/s12887-022-03678-4. BMC Pediatr. 2023. PMID: 36597064 Free PMC article.
-
Synchrotron X-ray Studies of the Structural and Functional Hierarchies in Mineralised Human Dental Enamel: A State-of-the-Art Review.Dent J (Basel). 2023 Apr 7;11(4):98. doi: 10.3390/dj11040098. Dent J (Basel). 2023. PMID: 37185477 Free PMC article. Review.
-
Assessment of demineralized tooth lesions using optical coherence tomography and other state-of-the-art technologies: a review.Biomed Eng Online. 2022 Dec 3;21(1):83. doi: 10.1186/s12938-022-01055-x. Biomed Eng Online. 2022. PMID: 36463182 Free PMC article. Review.
-
Maxillary incisor enamel defects in individuals born with cleft lip/palate.PLoS One. 2020 Dec 28;15(12):e0244506. doi: 10.1371/journal.pone.0244506. eCollection 2020. PLoS One. 2020. PMID: 33370403 Free PMC article.
-
Time-Lapse In Situ 3D Imaging Analysis of Human Enamel Demineralisation Using X-ray Synchrotron Tomography.Dent J (Basel). 2023 May 9;11(5):130. doi: 10.3390/dj11050130. Dent J (Basel). 2023. PMID: 37232781 Free PMC article.
References
-
- Bayram M., Deeley K., Reis M.F., Trombetta V.M., Ruff T.D., Sencak R.C., Hummel M., Dizak P.M., Washam K., Romanos H.F., et al. Genetic influences on dental enamel that impact caries differ between the primary and permanent dentitions. Eur. J. Oral Sci. 2015;123:327–334. doi: 10.1111/eos.12204. - DOI - PMC - PubMed
-
- Shimizu T., Ho B., Deeley K., Briseño-Ruiz J., Faraco I.M., Schupack B.I., Brancher J.A., Pecharki G.D., Küchler E.C., Tannure P.N., et al. Enamel Formation Genes Influence Enamel Microhardness Before and After Cariogenic Challenge. PLoS ONE. 2012;7:e45022. doi: 10.1371/journal.pone.0045022. - DOI - PMC - PubMed
LinkOut - more resources
Full Text Sources
Miscellaneous

