. 2020 Jul;68(7):1479-1494.
doi: 10.1002/glia.23796. Epub 2020 Feb 10.

Microglia in the hypothalamus respond to tumor-derived factors and are protective against cachexia during pancreatic cancer

Affiliations

Microglia in the hypothalamus respond to tumor-derived factors and are protective against cachexia during pancreatic cancer

Kevin G Burfeind et al. Glia. 2020 Jul.

Abstract

Microglia in the mediobasal hypothalamus (MBH) respond to inflammatory stimuli and metabolic perturbations to mediate body composition. This concept is well studied in the context of high fat diet induced obesity (HFDO), yet has not been investigated in the context of cachexia, a devastating metabolic syndrome characterized by anorexia, fatigue, and muscle catabolism. We show that microglia accumulate specifically in the MBH early in pancreatic ductal adenocarcinoma (PDAC)-associated cachexia and assume an activated morphology. Furthermore, we observe astrogliosis in the MBH and hippocampus concurrent with cachexia initiation. We next show that circulating immune cells resembling macrophages infiltrate the MBH. PDAC-derived factors induced microglia to express a transcriptional profile in vitro that was distinct from that induced by lipopolysaccharide (LPS). Microglia depletion through CSF1-R antagonism resulted in accelerated cachexia onset and increased anorexia, fatigue, and muscle catabolism during PDAC. This corresponded with increased hypothalamic-pituitary-adrenal (HPA) axis activation. CSF1-R antagonism had little effect on inflammatory response in the circulation, liver, or tumor. These findings demonstrate that microglia are protective against PDAC cachexia and provide mechanistic insight into this function.

Keywords: brain; cachexia; hypothalamus; microglia; neuroinflammation; pancreatic cancer.


Figures

Figure 1
Figure 1
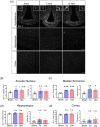
Microgliosis occurs in the MBH throughout PDAC cachexia. (a) Representative confocal microscopy images of Iba‐1 immunoreactivity within the MBH, hippocampus, and cortex from either a sham, 7 dpi, or 10 dpi mouse brain. Scale bar = 100 μm. Top left inset = arcuate nucleus microglia within left box. Top right inset = median eminence microglia within right box. Inset scale bars = 10 μm. B‐E) Analysis of microglia number (left) or percent area Iba‐1+ (right) in the arcuate nucleus, median eminence, hippocampus, or cortex. n.s. = not significant, ***p < .001, **p < .01, *p < .05 compared to sham in one‐way ANOVA analysis [Color figure can be viewed at wileyonlinelibrary.com]
Figure 2
Figure 2
Circulating immune cells infiltrate the MBH during PDAC. a) qRT‐PCR analysis for leukocyte adhesion molecule transcripts in RNA extracted from whole hypothalamic at 10 dpi. Results are relative to sham. ***p < .001 relative to sham comparing ΔCt values in repeated measures one‐way ANOVA. Results consist of two independent experiments combined. n = 4–8/group. (b) Representative 20X confocal images MBH from sham and tumor (10 dpi) mice with median eminence and arcuate nucleus labeled on sham section. ME = median eminence. ARC = arcuate nucleus. Scale bar = 100 μm. (c) Quantification of B. *p < .05 compared to sham in t‐test. n = 3/group. (d) Representative 60× image of ME from BMT GFP tumor mouse, at 10 dpi. Scale bar = 20 μm. Arrows = GFP + Iba‐1+ infiltrating macrophages [Color figure can be viewed at wileyonlinelibrary.com]
Figure 3
Figure 3
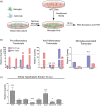
PDAC induces inflammatory mediator expression in vitro and in vivo. (a) Schematic representation of ex vivo KPC‐conditioned media treatment system. (b) qRT‐PCR analysis of pro‐inflammatory, anti‐inflammatory, and microglia‐associated transcript from primary microglia treated with either KPC‐conditioned media or 10 ng LPS. Values are relative to those from control media‐treated primary microglia. All comparisons at least p < .01 compared to control media‐treated in repeated measures one‐way ANOVA unless indicated otherwise. n.s. = not significant. n = 3/group. Results are representative of two independent experiments. (c) qRT‐PCR analysis of the same transcripts as B (except Tgfb) in RNA extracted from whole hypothalami. Results are relative to sham. ***p < .001, *p < .05 relative to sham comparing ΔCt values in repeated measures one‐way ANOVA. Results consist of two independent experiments combined. n = 4–8/group [Color figure can be viewed at wileyonlinelibrary.com]
Figure 4
Figure 4
Microglia depletion worsens anorexia and decreases locomotor activity during PDAC. (a) Schematic of PLX5622 treatment protocol and tumor inoculation. Diagram depicts three independent studies investigating various stages of cachexia. Numbers listed on number line are in relation to tumor inoculation. Day 0 = tumor inoculation day. (b) Daily food intake after tumor inoculation, with two sham groups shown for reference. AIN = control chow. For food intake analysis, study 2 and 3 were combined. (c) Total food intake during the first 5 days of the study (pre‐cachexia stage) and final 4 days of the study (cachexia stage). n.s. = not significant, ***p < .001 for Student's t‐test. (d) Dark cycle home cage locomotor activity after tumor inoculation, with two sham groups shown for reference. Data shown are study 2 and 3 pooled. (e) Sum of average hourly counts for the first 5 days of the study (pre‐cachexia stage) and final 4 days of the study (cachexia stage). n.s. = not significant, **p < .01 in Student's t‐test [Color figure can be viewed at wileyonlinelibrary.com]
Figure 5
Figure 5
Microglia depletion worsens muscle catabolism and is associated with increased HPA axis activity during PDAC. (a) Muscle catabolism, determined by gastrocnemius mass normalized to initial body weight. Studies were not pooled since normalized muscle mass varied between study. n.s. = not significant. For study 1 (as described in Figure 4), ***p < .001 in Student's t‐test. For studies 2 and 3, ***p < .001, *p < .05 in one‐way ANOVA analysis. (b) qRT‐PCR analysis of Mafbx, Murf1, and Foxo1 from RNA extracted from gastrocnemii. Values normalized to those from AIN 7d. PLX = PLX5622. n = 4–5/group. *p < .05 relative to AIN 10d comparing ΔCt values in Bonferroni post hoc analysis in two‐way ANOVA. (c) Serum corticosterone, measured by ELISA, at 7 and 10 dpi in PLX5622‐ and AIN‐treated tumor bearing mice. ***p < .001 in Bonferroni post hoc analysis in two‐way ANOVA. Cort = corticosterone. n = 4–5/group. (d) qRT‐PCR analysis of Kiss1, Gnrh, and Crh from RNA extracted from hypothalamic blocks at 7 and 10 dpi. Values normalized to those from AIN 7d. *p < .05 relative to AIN 10d comparing dCT values in Bonferroni post hoc analysis in two‐way ANOVA. n = 4–5/group [Color figure can be viewed at wileyonlinelibrary.com]
Figure 6
Figure 6
Minimal change in circulating and tumor‐associated immune cells after PLX5622 administration during PDAC. (a) Tumor mass in both AIN‐treated and PLX5622‐treated KPC‐bearing animals at 7 and 10 dpi. For all comparisons shown in this figure, p values reflect those from Bonferroni post‐hoc analysis in one‐way ANOVA analysis. (b) Total CD45+ cells in the tumors of AIN‐treated and PLX5622‐treated KPC‐bearing animals at 7 and 10 dpi. (c) Relative number of immune cells in the tumors of AIN‐treated and PLX5622‐treated KPC‐bearing animals at 7 and 10 dpi, expressed as a percentage of total CD45+ cells. (d) Relative number of immune cells in the blood of AIN‐treated and PLX5622‐treated KPC‐bearing animals at 7 and 10 dpi, expressed as a percentage of total CD45+ cells. (e) and (f) Total number of immune cells in the tumor (e) and blood (f) in AIN‐treated and PLX5622‐treated KPC‐bearing animals at 7 and 10 dpi n = 3–4/group
Figure 7
Figure 7
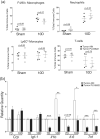
PLX5622 administration minimally effects liver inflammation during PDAC. (a) Quantification of different immune cell populations in the liver from sham animals and PDAC‐bearing animals. 10D = 10 days post inoculation. (b) qRT‐PCR of select inflammatory transcripts in the livers of PDAC‐bearing animals at 7 or 10 days post inoculation. For each transcript, values are normalized to that from 7 dpi. AIN tumor‐bearing group. ***p < .001, **p < .001 *p < .05 comparing AIN group to PLX56222 group in Bonferroni post hoc analysis in one‐way ANOVA. For all experiments, n = 3–4/group

Similar articles

Cited by

References

    1. Bachmann, J. , Heiligensetzer, M. , Krakowski‐Roosen, H. , Buchler, M. W. , Friess, H. , & Martignoni, M. E. (2008). Cachexia worsens prognosis in patients with resectable pancreatic cancer. Journal of Gastrointestinal Surgery, 12(7), 1193–1201. 10.1007/s11605-008-0505-z - DOI - PubMed
    1. Baufeld, C. , Osterloh, A. , Prokop, S. , Miller, K. R. , & Heppner, F. L. (2016). High‐fat diet‐induced brain region‐specific phenotypic spectrum of CNS resident microglia. Acta Neuropathologica, 132(3), 361–375. 10.1007/s00401-016-1595-4 - DOI - PMC - PubMed
    1. Béchade, C. , Cantaut‐Belarif, Y. , & Bessis, A. (2013). Microglial control of neuronal activity. Frontiers in Cellular Neuroscience, 7, 32–32. 10.3389/fncel.2013.00032 - DOI - PMC - PubMed
    1. Bossy‐Wetzel, E. , Talantova, M. V. , Lee, W. D. , Schölzke, M. N. , Harrop, A. , Mathews, E. , … Lipton, S. A. (2004). Crosstalk between nitric oxide and zinc pathways to neuronal cell death involving mitochondrial dysfunction and p38‐activated K+ channels. Neuron, 41(3), 351–365. 10.1016/S0896-6273(04)00015-7 - DOI - PubMed
    1. Braun, T. P. , & Marks, D. L. (2015). The regulation of muscle mass by endogenous glucocorticoids. Frontiers in Physiology, 6, 12–12. 10.3389/fphys.2015.00012 - DOI - PMC - PubMed

Publication types

  NODES
admin 5
twitter 2