MYCN Silencing by RNAi Induces Neurogenesis and Suppresses Proliferation in Models of Neuroblastoma with Resistance to Retinoic Acid
- PMID: 32240058
- PMCID: PMC7415885
- DOI: 10.1089/nat.2019.0831
MYCN Silencing by RNAi Induces Neurogenesis and Suppresses Proliferation in Models of Neuroblastoma with Resistance to Retinoic Acid
Abstract
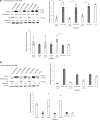
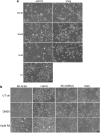
Neuroblastoma (NB) is the most common solid tumor in childhood. Twenty percent of patients display MYCN amplification, which indicates a very poor prognosis. MYCN is a highly specific _target for an NB tumor therapy as MYCN expression is absent or very low in most normal cells, while, as a transcription factor, it regulates many essential cell activities in tumor cells. We aim to develop a therapy for NB based on MYCN silencing by short interfering RNA (siRNA) molecules, which can silence _target genes by RNA interference (RNAi), a naturally occurring method of gene silencing. It has been shown previously that MYCN silencing can induce apoptosis and differentiation in MYCN amplified NB. In this article, we have demonstrated that siRNA-mediated silencing of MYCN in MYCN-amplified NB cells induced neurogenesis in NB cells, whereas retinoic acid (RA) treatment did not. RA can differentiate NB cells and is used for treatment of residual disease after surgery or chemotherapy, but resistance can develop. In addition, MYCN siRNA treatment suppressed growth in a MYCN-amplified NB cell line more than that by RA. Our result suggests that gene therapy using RNAi _targeting MYCN can be a novel therapy toward MYCN-amplified NB that have complete or partial resistance toward RA.
Keywords: MYCN; neuroblastoma; retinoic acid treatment; siRNA.
Conflict of interest statement
No competing financial interests exist.
Figures


Similar articles
-
The MYCN inhibitor BGA002 restores the retinoic acid response leading to differentiation or apoptosis by the mTOR block in MYCN-amplified neuroblastoma.J Exp Clin Cancer Res. 2022 Apr 30;41(1):160. doi: 10.1186/s13046-022-02367-5. J Exp Clin Cancer Res. 2022. PMID: 35490242 Free PMC article.
-
Use of RNA interference to elucidate the effect of MYCN on cell cycle in neuroblastoma.Pediatr Blood Cancer. 2008 Feb;50(2):208-12. doi: 10.1002/pbc.21195. Pediatr Blood Cancer. 2008. PMID: 17420990
-
Silencing of MYCN by RNA interference induces growth inhibition, apoptotic activity and cell differentiation in a neuroblastoma cell line with MYCN amplification.Int J Oncol. 2007 May;30(5):1189-96. Int J Oncol. 2007. PMID: 17390021
-
A Novel MYCN-Specific Antigene Oligonucleotide Deregulates Mitochondria and Inhibits Tumor Growth in MYCN-Amplified Neuroblastoma.Cancer Res. 2019 Dec 15;79(24):6166-6177. doi: 10.1158/0008-5472.CAN-19-0008. Epub 2019 Oct 15. Cancer Res. 2019. PMID: 31615807
-
MYCN Impact on High-Risk Neuroblastoma: From Diagnosis and Prognosis to _targeted Treatment.Cancers (Basel). 2022 Sep 12;14(18):4421. doi: 10.3390/cancers14184421. Cancers (Basel). 2022. PMID: 36139583 Free PMC article. Review.
Cited by
-
KDM5B expression in cisplatin resistant neuroblastoma cell lines.Oncol Lett. 2022 Aug 31;24(4):365. doi: 10.3892/ol.2022.13485. eCollection 2022 Oct. Oncol Lett. 2022. PMID: 36238850 Free PMC article.
-
A Focus on Regulatory Networks Linking MicroRNAs, Transcription Factors and _target Genes in Neuroblastoma.Cancers (Basel). 2021 Nov 3;13(21):5528. doi: 10.3390/cancers13215528. Cancers (Basel). 2021. PMID: 34771690 Free PMC article. Review.
-
In Vitro Assessment of the Role of p53 on Chemotherapy Treatments in Neuroblastoma Cell Lines.Pharmaceuticals (Basel). 2021 Nov 19;14(11):1184. doi: 10.3390/ph14111184. Pharmaceuticals (Basel). 2021. PMID: 34832966 Free PMC article.
-
TRAF4 Silencing Induces Cell Apoptosis and Improves Retinoic Acid Sensitivity in Human Neuroblastoma.Neurochem Res. 2023 Jul;48(7):2116-2128. doi: 10.1007/s11064-023-03882-3. Epub 2023 Feb 16. Neurochem Res. 2023. PMID: 36795185
-
Molecular Mechanisms of MYCN Dysregulation in Cancers.Front Oncol. 2021 Feb 3;10:625332. doi: 10.3389/fonc.2020.625332. eCollection 2020. Front Oncol. 2021. PMID: 33614505 Free PMC article. Review.
References
-
- Buechner J and Einvik C (2012). N-myc and noncoding RNAs in neuroblastoma. Mol Cancer Res 10:1243–1253 - PubMed
-
- Pichler M and Calin. GA (2014). Long noncoding RNA in neuroblastoma: new light on the (old) N-Myc story. J Natl Cancer Inst 106:dju150. - PubMed
-
- Maris JM, Hogarty MD, Bagatell R and Cohn SL (2007). Neuroblastoma. Lancet 369:2106–2120 - PubMed
Publication types
MeSH terms
Substances
Grants and funding
LinkOut - more resources
Full Text Sources
Other Literature Sources
Medical

