. 2020 Apr 20;11(4):247.
doi: 10.1038/s41419-020-2454-8.

Transient receptor potential ion channel TRPM2 promotes AML proliferation and survival through modulation of mitochondrial function, ROS, and autophagy

Affiliations

Transient receptor potential ion channel TRPM2 promotes AML proliferation and survival through modulation of mitochondrial function, ROS, and autophagy

Shu-Jen Chen et al. Cell Death Dis. .

Abstract

Transient receptor potential melastatin 2 (TRPM2) ion channel has an essential function in maintaining cell survival following oxidant injury. Here, we show that TRPM2 is highly expressed in acute myeloid leukemia (AML). The role of TRPM2 in AML was studied following depletion with CRISPR/Cas9 technology in U937 cells. In in vitro experiments and in xenografts, depletion of TRPM2 in AML inhibited leukemia proliferation, and doxorubicin sensitivity was increased. Mitochondrial function including oxygen consumption rate and ATP production was reduced, impairing cellular bioenergetics. Mitochondrial membrane potential and mitochondrial calcium uptake were significantly decreased in depleted cells. Mitochondrial reactive oxygen species (ROS) were significantly increased, and Nrf2 was decreased, reducing the antioxidant response. In TRPM2-depleted cells, ULK1, Atg7, and Atg5 protein levels were decreased, leading to autophagy inhibition. Consistently, ATF4 and CREB, two master transcription factors for autophagosome biogenesis, were reduced in TRPM2-depleted cells. In addition, Atg13 and FIP200, which are known to stabilize ULK1 protein, were decreased. Reconstitution with TRPM2 fully restored proliferation, viability, and autophagy; ATF4 and CREB fully restored proliferation and viability but only partially restored autophagy. TRPM2 expression reduced the elevated ROS found in depleted cells. These data show that TRPM2 has an important role in AML proliferation and survival through regulation of key transcription factors and _target genes involved in mitochondrial function, bioenergetics, the antioxidant response, and autophagy. _targeting TRPM2 may represent a novel therapeutic approach to inhibit myeloid leukemia growth and enhance susceptibility to chemotherapeutic agents through multiple pathways.


Conflict of interest statement

The authors declare that they have no conflict of interest.

Figures
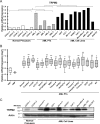
Fig. 1
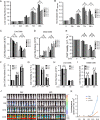
Fig. 1. Quantitation of endogenous TRPM2 in primary AML cells, AML cell lines, CD33+ and CD34+ precursors, and normal hematopoietic progenitors.
a RT-PCR was performed with primers specific for TRPM2 using RNA from CD33+ (n = 2) and CD34+ (n = 4) hematopoietic precursors, primary AML patient samples (n = 5), and human leukemia cell lines (n = 9). Data were normalized to expression in U937 cells. Duplicate measurements of each sample were made. Statistical differences between groups were analyzed with unpaired, two-tailed t-test. *p < 0.05. b TRPM2 expression in AML patients was examined and compared with expression in normal human bone marrow hematopoietic progenitors using the Bloodspot Database (Fig. 1b). Data were normalized as described previously. Expression of TRPM2 in AML samples (n = 1889) from patients with no karyotypic abnormalities (normal), or different cytogenetic subgroups including aberrant complex karyotypes, inv(16), t(15;17), t(8;21), and t(11q23)/MLL was significantly greater than that found in hematopoietic stem cells (HSC, n = 6) or common myeloid progenitor cells (CMP, n = 3) isolated from normal bone marrow. The median 25–75 percentiles are boxed and the 10–90 percentiles for each group shown with bars. The median is shown with a line. Significance was assessed by one-way ANOVA. *p ≤ 0.05; **p ≤ 0.001 for AML samples in comparison to HSC and CMP. c Western blotting was performed with lysates from two CD34+ preparations isolated from normal human bone marrow and from nine AML cell lines in which TRPM2 mRNA was quantitated in (a). Blots were probed with anti-TRPM2-C or anti-actin antibodies.
Fig. 2
Fig. 2. Characterization of ADPR-activated cationic currents in leukemia cells in which TRPM2 is depleted.
a RT-PCR of TRPM2 in wild type (Wt), scrambled control (three clones, Scr-1-3), or TRPM2-depleted (KO-1-3) U937 cells. Primers to Rpl32 (ribosomal protein 32) were used as control. b Western blotting of lysates from three scrambled and three KO clones compared with parental wild type U937 cells. Actin was used as the loading control to confirm equivalent protein loaded/lane. c Whole cell patch-clamp of Wt, TRPM2-depleted, or scrambled control U937 cells. Intracellular application of ADPR (300 µM) elicited large cation currents in Wt cells (solid blue circle, n = 4) and scrambled (solid red square, n = 4), but not KO (solid blue diamond, n = 4) cells. Mean ± s.e.m. for each data point is shown. Error bars are not shown if they fell within the boundaries of the symbol. p < 0.001, two-way ANOVA for TRPM2 KO vs scrambled and wild-type control cells with ADPR. Omission of ADPR in pipette solutions resulted in background currents in scrambled (open red square, n = 5), and Wt control cells (open blue circle, n = 5), similar to KO cells with ADPR.
Fig. 3
Fig. 3. TRPM2 depletion reduces proliferation and increases doxorubicin sensitivity.
ae U937 scrambled control cells (Scr clones 1-3) or TRPM2-depleted U937 cells (KO clones 1-3) were studied at 0 to 96 h after plating (a, b). Equal numbers of cells/group were also treated with 0.1 μM doxorubicin for 48 or 72 h (c, d, e). Cell proliferation was measured by trypan blue exclusion (a) or XTT assay (b), and viability after exposure to doxorubicin by trypan blue (c, d, e). Results are expressed as live (a, c) or dead cell number (d), percent viability (e), or normalized OD reading of plated cells (b). Values are means ± s.e.m. for one experiment of two (a, ce, n = 18) with trypan blue exclusion and means ± s.e.m. from three combined experiments performed with XTT (b, n = 24). Data for the second experiment with trypan blue is shown in Supplemental Information Fig. 1(a, c–e). (ae), *p ≤ 0.0001; group effect, Scr vs KO, two-way ANOVA. f–i TRPM2 reconstitution. TRPM2-depleted U937 cells were stably transfected with empty vector (KO-V) or wild type TRPM2 (KO-L). Proliferation over 0-48 h (f), and viability (g) and live vs dead cell number (h, i) 24 and 48 h after treatment with 0.3 µM doxorubicin were measured. One experiment of two quantitated with trypan blue exclusion using pooled clones for TRPM2 reconstitution is shown here (mean ± s.e.m., n = 8). (fi), *p < 0.008, subgroup analysis, Bonferroni correction, two-way ANOVA. The second experiment is shown in Supplemental Information Fig. 1f–i. (j, k) NSG mice were injected intravenously with 8 × 103 U937 cells depleted of TRPM2 (KO) or scrambled control cells transfected with the pCDH-EF1-Luc2-P2A-tdTomato vector. Mice were injected with luciferin and luminescence quantitated every 2–3 days with the IVIS System for 16 days. Mice injected with cells depleted of TRPM2 showed significantly reduced leukemia growth compared with scrambled controls (n = 12 mice/group/experiment). Three experiments were performed. Mean ± s.e.m. for each time point from one experiment is shown. *p ≤ 0.01, unpaired, two-tailed t-test. Two additional experiments are shown in Supplemental Information Fig. 2.
Fig. 4
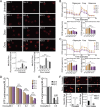
Fig. 4. Mitochondrial function is reduced in TRPM2 depletion.
a Mitochondrial ROS were quantitated in TRPM2-depleted (KO-1-3) and scrambled control U937 cells (Scr-1-3) with MitoSOX Red and confocal microscopy at baseline and 24 h after treatment with 0.1 μM doxorubicin. Fluorescence intensity was quantitated in a minimum of 2–10 cells/field in at least 10 fields/group in each experiment. A sample field is shown for untreated (top) and doxorubicin treated cells (bottom) from each group. Mean ± s.e.m. fluorescence intensity for each clone of untreated cells calculated from three experiments is shown below on the left. The fluorescence intensity (mean ± s.e.m.) for each clone of doxorubicin treated cells from five experiments is shown below on the right. ****p < 0.0001, paired, two-tailed t-test. b O2 consumption rate was measured in U937 cells depleted of TRPM2 (KO-1-3) and scrambled control cells (Scr-1-3). TOP: After basal OCR was obtained, oligomycin (2 µM) was added to inhibit F0F1ATPase (Complex V). The uncoupler FCCP (0.125 µM) was then added and maximal OCR was measured. Each point in the traces represents the average of 6 different wells. Basal (bottom left) and maximal (bottom right) mean ± s.e.m. OCRs of the 6 groups of cells calculated from four experiments are shown (n = 24/group). *p < 0.02 basal, ****p < 0.0001 maximal, paired, two-tailed t-test. c O2 consumption rate was measured in U937 cells depleted of TRPM2 (KO-1-3) and scrambled control cells (Scr-1-3) 24 hours after treatment with 0.1 μM doxorubicin. Mean ± s.e.m. OCRs of the 6 groups of cells from three experiments were calculated (n = 18/group). *p ≤ 0.02 basal, **p < 0.002 maximal, paired, two-tailed t-test. d ATP levels were measured in TRPM2-depleted (KO-1-3) or scrambled control cells (Scr-1-3) with the Cell Titer Glow Assay 24 h after treatment with 0.1–0.5 μM doxorubicin. Results are expressed as ATP luminescence units. Means ± s.e.m. were calculated from 2 experiments (n = 7). *p < 0.0001 group effect; **p < 0001 group × doxorubicin exposure time interaction effect, two-way ANOVA. e ATP levels were measured in TRPM2-depleted cells (KO-1) transfected with empty vector (KO-V) or wild type full length TRPM2 (KO-L). Control was scrambled cells transfected with vector (Scr-V). Means ± s.e.m. were calculated from two experiments (n = 6). **p < 0.002 Scr-V vs KO-V; ***p < 0.0002, KO-V vs KO-L, two-way ANOVA. f ROS levels in scrambled control cells expressing empty vector (Scr-V) or TRPM2-depleted cells expressing empty vector (V) or TRPM2 (L) were measured with Mitosox Red. Fluorescence intensity was quantitated in a minimum of 1–13 cells/field for untreated cells (n = 8–11 fields/group) and in 15 fields/group for doxorubicin treated cells. Mean ± s.e.m. fluorescence intensity for each clone is shown. Differences were analyzed with one-way ANOVA (*p < 0.05; ****p < 0.0001).
Fig. 5
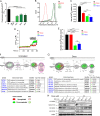
Fig. 5. TRPM2 KO alters mitochondrial membrane potential (Δψm) and mitochondrial calcium uptake.
a Quantification of Δψm with JC-10 in Wt and three KO clones, and Wt cells pretreated with FCCP as a control. Mean ± s.e.m. was calculated for each group from three experiments (n = 5/group). ****p ≤ 0.0001, paired, two-tailed t-test. b Individual traces of Δψm in Wt and KO cells. c Quantification of the rate of [Ca2+]m uptake in Wt and KO cells with or without doxorubicin as a function of decrease in bath Ca2+ over 250 s after a single extramitochondrial Ca2+ pulse (3 µM). Data represent mean ± s.e.m.; ***p < 0.001; n = 7/group. d Traces of [Ca2+]out (extramitochondrial) in Wt and KO cells with or without doxorubicin during six extramitochondrial Ca2+ pulses. e Quantification of [Ca2+]m uptake as a function of decrease in bath Ca2+ calculated as number of Ca2+ pulses cleared after six extramitochondrial Ca2+ pulses (3 µM). Data represent mean ± s.e.m.; ***p < 0.001; n = 7. f, g Ingenuity Pathways Analysis of changes in mitochondrial proteins in TRPM2-depleted leukemia cells. Global label-free proteomics analysis was performed using U937 cells in which TRPM2 was depleted with CRISPR, or scrambled control cells. Cell were untreated (f) or treated with doxorubicin (g). Results demonstrated a decrease in Complex I, II, and IV proteins and an increase in Complex V in untreated KO cells. Color code for intensity and direction of differences in KO is shown below f. After doxorubicin, there was a further decline in Complex I and IV proteins, and a decline in Complex V proteins in the KO. Individual electron transport proteins which showed the greatest modulation by TRPM2 are identified in boxes (f, g). h Changes in COX6B1, NDUFA13, MT-ND2, and MT-CO2 were confirmed by western blotting of two scrambled (2,3) and two KO clones (1,2) (see Supplemental Information Fig. 3).
Fig. 6
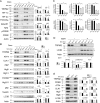
Fig. 6. Impaired transcriptional regulation and autophagy protein expression in TRPM2-depleted U937 leukemia cells.
a Western blotting was performed to determine expression of HIF-1α, HIF-2α, FOXO3a, IQGAP1, Nrf2, CREB, and CREB phosphorylation in TRPM2-depleted U937 cells. In these experiments, two knockout (KO-1-2) and two scrambled clones (Scr-2-3) were selected randomly for western blots with or without treatment with 0.3 µM doxorubicin. b Expression of autophagy proteins ULK1, Atg7, Atg5, Atg13, FIP200, Atg101, and transcription factor ATF4 was examined by western blotting. p62, Tom20, and LC3B-I and II, which are modified in autophagy, were also studied. Actin was probed to confirm equivalent loading. In a and b, western blots performed for each protein are shown on the left. One blot for each protein is shown here and the others in Supplemental Information Figs. 4, 5. Densitometry measurements from two to three experiments for each protein were standardized to results for each experiment’s average untreated scrambled control and means ± s.e.m. calculated and shown on the right (n = 4-6, Tom20 n = 8). *p ≤ 0.001, **p < 0.03, group effect, Scr vs KO, two-way ANOVA. c RT-PCR was used to measure TRPM2, HIF-1α, HIF-2α, CREB, ULK1, and Atg7 mRNA in TRPM2-depleted leukemia cells. Results summarizing two (TRPM2, ULK1), three (Atg7) or four (HIF-1/2α, CREB) experiments are shown (mean ± s.e.m., n = 8-16). *p ≤ 0.0001, **p < 0.015, one-way ANOVA. d U937 cell were incubated with or without bafilomycin A1, and conversion of LCB-I to II was examined with western blotting. Four experiments were performed. One blot is shown here and the others in Supplemental Information Fig. 6. Densitometry measurements were obtained. Relative autophagic flux was calculated as: (O.D. LC3B-II + Bafilomycin/O.D. Actin) - (O.D. LC3B-II-Bafilomycin/O.D. Actin) for each band. Means ± s.e.m. for the four experiments for each cell line are shown below the figure (n = 8). *p < 0.05, unpaired, two-tailed t-test. e Western blotting was performed to measure TRPM2, CREB, ATF4, ULK1, Atg7, Atg5, and LC3B-I and II expression in four experiments after TRPM2-L reconstitution. One blot is shown here and the others in Supplemental Information Fig. 7. Densitometry measurements were normalized to each blots’ untreated scrambled control, and mean densitometry measurements ± s.e.m. for experiments with each protein are shown on the right. *p < 0.04 (n = 4) one-way ANOVA.
Fig. 7
Fig. 7. Knockdown of TRPM2 in AML-193 leukemia cells.
TRPM2 was reduced in AML-193 with shRNA _targeted to TRPM2 and stable transfectants were generated. Pooled knockdown and control cells were studied. a The equivalent numbers of AML-193 scrambled control (Scr) and TRPM2 knockdown (KD) cells were plated at time 0 in two experiments. Cell proliferation was measured with XTT at 0-72 h after plating and both experiments are shown as mean ± s.e.m. OD490–690 normalized for each group to time 0 cells (n = 4–6/experiment). *p < 0.0001, group effect, Scr vs KD; *p < 0.0001, time effect; *p < 0.0125, group × time interaction effect, two-way ANOVA, indicating that differences between groups are amplified by time. b Cell viability was measured at 48 h after doxorubicin (0.1 µM) exposure with XTT. Mean ± s.e.m. of OD490–690 normalized to time 0 from three experiments are shown for Scr and TRPM2 knockdown cells (n=12). p < 0.01, group effect, two-way ANOVA. ce Viability was also measured after 24–48 h of treatment with 0.3 µM doxorubicin with trypan blue exclusion. Mean ± s.e.m. number of live (c) or dead cells (d) from two experiments is shown, (n = 16). Percent viability from the two experiments (mean ± s.e.m.) is presented in e (n = 16). In ce *p < 0.0001, group effect, two-way ANOVA. f Western blots of expression of TRPM2, ULK1, Atg7, Atg5, CREB and actin with untreated scrambled or knockdown cells are shown. Densitometry measurements were normalized to each blots’ scrambled control in three experiments, and mean normalized densitometry measurements ± s.e.m. for the three are shown on the right. *p < 0.02, nonparametric, unpaired, two-tailed t-test. Full western blots for each antibody in all experiments are shown in Supplemental Information Fig. 8.
Fig. 8
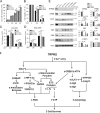
Fig. 8. Reconstitution of ATF4 or CREB in TRPM2 in depleted cells restored cell proliferation, viability, and expression of autophagy proteins.
TRPM2-depleted U937 cells were stably transfected with empty vector (KO-V), ATF4 (KO-ATF4) or CREB (KO-CREB) and 20 × 104 cells were plated. a Proliferation was quantitated as live cell number by trypan blue exclusion over 0–72 h. Viability at 24 and 48 h after treatment with 0.3 µM doxorubicin was quantitated as b % viable cells, c live cell and d dead cell number. Mean ± s.e.m. is shown (n = 8). *p < 0.0167, subgroup analysis, Bonferroni correction, two-way ANOVA. Three additional experiments analyzed with XTT to assess viability are shown in Supplemental Information Fig. 9. e Western blotting was done on two or three experiments to assess TRPM2, CREB, ATF4, ULK1, Atg7, Atg5, and four for LC3B-I and II expression using two clones reconstituted with ATF4 or CREB. Densitometry measurements were normalized to each blots’ untreated scrambled control, and mean densitometry measurements ± s.e.m. for the experiments are shown on the right. One blot for each protein is shown here, and the others in Supplemental Information Fig. 9e. *p < 0.05, one-way ANOVA. f Schema of TRPM2 modulation of mitochondrial function, ROS production, autophagy, and cell survival in leukemia.

Similar articles

Cited by

References

    1. Farquhar MJ, Bowen DT. Oxidative stress and the myelodysplastic syndromes. Int. J. Hematol. 2003;77:342–350. doi: 10.1007/BF02982641. - DOI - PubMed
    1. Sallmyr A, Fan J, Rassool FV. Genomic instability in myeloid malignancies: increased reactive oxygen species (ROS), DNA double strand breaks (DSBs) and error-prone repair. Cancer Lett. 2008;270:1–9. doi: 10.1016/j.canlet.2008.03.036. - DOI - PubMed
    1. Miller BA, Zhang W. TRP channels as mediators of oxidative stress. Adv. Exp. Med. Biol. 2011;704:531–544. doi: 10.1007/978-94-007-0265-3_29. - DOI - PubMed
    1. Hole PS, Darley RL, Tonks A. Do reactive oxygen species play a role in myeloid leukemias? Blood. 2011;117:5816–5826. doi: 10.1182/blood-2011-01-326025. - DOI - PubMed
    1. Schumacker PT. Reactive oxygen species in cancer cells: live by the sword, die by the sword. Cancer Cell. 2006;10:175–176. doi: 10.1016/j.ccr.2006.08.015. - DOI - PubMed

Publication types

MeSH terms

  NODES
twitter 2