An Intersectional Viral-Genetic Method for Fluorescent Tracing of Axon Collaterals Reveals Details of Noradrenergic Locus Coeruleus Structure
- PMID: 32354756
- PMCID: PMC7294462
- DOI: 10.1523/ENEURO.0010-20.2020
An Intersectional Viral-Genetic Method for Fluorescent Tracing of Axon Collaterals Reveals Details of Noradrenergic Locus Coeruleus Structure
Abstract
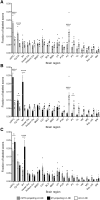
Understanding the function of broadly projecting neurons depends on comprehensive knowledge of the distribution and _targets of their axon collaterals. While retrograde tracers and, more recently, retrograde viral vectors have been used to identify efferent projections, they have limited ability to reveal the full pattern of axon collaterals from complex, heterogeneous neuronal populations. Here we describe TrAC (tracing axon collaterals), an intersectional recombinase-based viral-genetic strategy that allows simultaneous visualization of axons from a genetically defined neuronal population and a projection-based subpopulation. To test this new method, we have applied TrAC to analysis of locus coeruleus norepinephrine (LC-NE)-containing neurons projecting to medial prefrontal cortex (mPFC) and primary motor cortex (M1) in laboratory mice. TrAC allowed us to label each projection-based LC-NE subpopulation, together with all remaining LC-NE neurons, in isolation from other noradrenergic populations. This analysis revealed mPFC-projecting and M1-projecting LC-NE subpopulations differ from each other and from the LC as a whole in their patterns of axon collateralization. Thus, TrAC complements and extends existing axon tracing methods by permitting analyses that have not previously been possible with complex genetically defined neuronal populations.
Keywords: CAV2; axon tracing; locus coeruleus; noradrenergic; norepinephrine; recombinase.
Copyright © 2020 Plummer et al.
Figures


Similar articles
-
Probing the structure and function of locus coeruleus projections to CNS motor centers.Front Neural Circuits. 2022 Sep 29;16:895481. doi: 10.3389/fncir.2022.895481. eCollection 2022. Front Neural Circuits. 2022. PMID: 36247730 Free PMC article.
-
Viral-genetic tracing of the input-output organization of a central noradrenaline circuit.Nature. 2015 Aug 6;524(7563):88-92. doi: 10.1038/nature14600. Epub 2015 Jul 1. Nature. 2015. PMID: 26131933 Free PMC article.
-
Hypocretin1/OrexinA-containing axons innervate locus coeruleus neurons that project to the Rat medial prefrontal cortex. Implication in the sleep-wakefulness cycle and cortical activation.Synapse. 2011 Sep;65(9):843-57. doi: 10.1002/syn.20912. Epub 2011 Mar 10. Synapse. 2011. PMID: 21308795
-
Evidence for a specialized role of the locus coeruleus noradrenergic system in cortical circuitries and behavioral operations.Brain Res. 2016 Jun 15;1641(Pt B):197-206. doi: 10.1016/j.brainres.2015.11.022. Epub 2015 Nov 25. Brain Res. 2016. PMID: 26607255 Free PMC article. Review.
-
Projection specificity in heterogeneous locus coeruleus cell populations: implications for learning and memory.Learn Mem. 2015 Sep 1;22(9):444-51. doi: 10.1101/lm.037283.114. Print 2015 Sep. Learn Mem. 2015. PMID: 26330494 Free PMC article. Review.
Cited by
-
Sleep disturbances in autism spectrum disorder: Animal models, neural mechanisms, and therapeutics.Neurobiol Sleep Circadian Rhythms. 2023 Apr 26;14:100095. doi: 10.1016/j.nbscr.2023.100095. eCollection 2023 May. Neurobiol Sleep Circadian Rhythms. 2023. PMID: 37188242 Free PMC article. Review.
-
Mechanisms of neuromodulatory volume transmission.Mol Psychiatry. 2024 Nov;29(11):3680-3693. doi: 10.1038/s41380-024-02608-3. Epub 2024 May 24. Mol Psychiatry. 2024. PMID: 38789677 Free PMC article. Review.
-
Shining light on the noradrenergic system.Neurophotonics. 2023 Oct;10(4):044406. doi: 10.1117/1.NPh.10.4.044406. Epub 2023 Sep 26. Neurophotonics. 2023. PMID: 37766924 Free PMC article. Review.
-
Anatomically and functionally distinct locus coeruleus efferents mediate opposing effects on anxiety-like behavior.Neurobiol Stress. 2020 Dec 5;13:100284. doi: 10.1016/j.ynstr.2020.100284. eCollection 2020 Nov. Neurobiol Stress. 2020. PMID: 33344735 Free PMC article.
-
Delta Opioid Receptors and Enkephalinergic Signaling within Locus Coeruleus Promote Stress Resilience.Brain Sci. 2022 Jun 29;12(7):860. doi: 10.3390/brainsci12070860. Brain Sci. 2022. PMID: 35884666 Free PMC article.
References
-
- Aston-Jones G (2004) Locus coeruleus, A5 and A7 noradrenergic cell groups In: The rat nervous system (Paxinos G, ed), pp 253–294. San Diego: Academic Press.
Publication types
MeSH terms
Substances
Grants and funding
LinkOut - more resources
Full Text Sources
