Production and secretion dynamics of prokaryotic Penicillin G acylase in Pichia pastoris
- PMID: 32424437
- PMCID: PMC7306039
- DOI: 10.1007/s00253-020-10669-x
Production and secretion dynamics of prokaryotic Penicillin G acylase in Pichia pastoris
Abstract
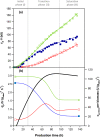
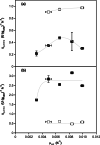
To take full advantage of recombinant Pichia pastoris (Komagataella phaffii) as a production system for heterologous proteins, the complex protein secretory process should be understood and optimised by circumventing bottlenecks. Typically, little or no attention has been paid to the fate of newly synthesised protein inside the cell, or its passage through the secretory pathway, and only the secreted product is measured. However, the system's productivity (i.e. specific production rate qp), includes productivity of secreted (qp,extra) plus intracellularly accumulated (qp,intra) protein. In bioreactor cultivations with P. pastoris producing penicillin G acylase, we studied the dynamics of product formation, i.e. both the specific product secretion (qp,extra) and product retention (qp,intra) as functions of time, as well as the kinetics, i.e. productivity in relation to specific growth rate (μ). Within the time course, we distinguished (I) an initial phase with constant productivities, where the majority of product accumulated inside the cells, and qp,extra, which depended on μ in a bell-shaped manner; (II) a transition phase, in which intracellular product accumulation reached a maximum and productivities (intracellular, extracellular, overall) were changing; (III) a new phase with constant productivities, where secretion prevailed over intracellular accumulation, qp,extra was linearly related to μ and was up to three times higher than in initial phase (I), while qp,intra decreased 4-6-fold. We show that stress caused by heterologous protein production induces cellular imbalance leading to a secretory bottleneck that ultimately reaches equilibrium. This understanding may help to develop cultivation strategies for improving protein secretion from P. pastoris.Key Points• A novel concept for industrial bioprocess development.• A Relationship between biomass growth and product formation in P. pastoris.• A Three (3) phases of protein production/secretion controlled by the AOX1-promoter.• A Proof of concept in production of industrially relevant penicillin G acylase.
Keywords: Fedbatch bioreactor cultivation; Penicillin G acylase; Pichia pastoris; Process optimisation; Secretion of a heterologous protein; Specific rate of product formation.
Conflict of interest statement
The authors declare that they have no conflict of interest.
Figures


Similar articles
-
Engineering of the unfolded protein response pathway in Pichia pastoris: enhancing production of secreted recombinant proteins.Appl Microbiol Biotechnol. 2021 Jun;105(11):4397-4414. doi: 10.1007/s00253-021-11336-5. Epub 2021 May 26. Appl Microbiol Biotechnol. 2021. PMID: 34037840 Free PMC article. Review.
-
Bioprocess performance analysis of novel methanol-independent promoters for recombinant protein production with Pichia pastoris.Microb Cell Fact. 2021 Mar 23;20(1):74. doi: 10.1186/s12934-021-01564-9. Microb Cell Fact. 2021. PMID: 33757505 Free PMC article.
-
Potential of Pichia pastoris for the production of industrial penicillin G acylase.Folia Microbiol (Praha). 2017 Sep;62(5):417-424. doi: 10.1007/s12223-017-0512-0. Epub 2017 Mar 9. Folia Microbiol (Praha). 2017. PMID: 28281229
-
Effects of glycerol supply and specific growth rate on methanol-free production of CALB by P. pastoris: functional characterisation of a novel promoter.Appl Microbiol Biotechnol. 2017 Apr;101(8):3163-3176. doi: 10.1007/s00253-017-8123-x. Epub 2017 Jan 27. Appl Microbiol Biotechnol. 2017. PMID: 28130631 Free PMC article.
-
Cultivation strategies to enhance productivity of Pichia pastoris: A review.Biotechnol Adv. 2015 Nov 1;33(6 Pt 2):1177-93. doi: 10.1016/j.biotechadv.2015.05.008. Epub 2015 May 29. Biotechnol Adv. 2015. PMID: 26027890 Review.
Cited by
-
Exploitation of E. coli for the production of penicillin G amidase: a tool for the synthesis of semisynthetic β-lactam antibiotics.J Genet Eng Biotechnol. 2021 Oct 15;19(1):156. doi: 10.1186/s43141-021-00263-7. J Genet Eng Biotechnol. 2021. PMID: 34652570 Free PMC article. Review.
-
Engineering of the unfolded protein response pathway in Pichia pastoris: enhancing production of secreted recombinant proteins.Appl Microbiol Biotechnol. 2021 Jun;105(11):4397-4414. doi: 10.1007/s00253-021-11336-5. Epub 2021 May 26. Appl Microbiol Biotechnol. 2021. PMID: 34037840 Free PMC article. Review.
-
Enzyme-catalyzed biodegradation of penicillin fermentation residues by β-lactamase OtLac from Ochrobactrum tritici.Microb Cell Fact. 2021 Jun 13;20(1):117. doi: 10.1186/s12934-021-01606-2. Microb Cell Fact. 2021. PMID: 34120587 Free PMC article.
References
MeSH terms
Substances
Supplementary concepts
Grants and funding
LinkOut - more resources
Full Text Sources
Research Materials

