. 2020 May 26;15(5):e0233191.
doi: 10.1371/journal.pone.0233191. eCollection 2020.

Integration of high-throughput reporter assays identify a critical enhancer of the Ikzf1 gene

Affiliations

Integration of high-throughput reporter assays identify a critical enhancer of the Ikzf1 gene

Jaafar Alomairi et al. PLoS One. .

Erratum in

Abstract

The Ikzf1 locus encodes the lymphoid specific transcription factor Ikaros, which plays an essential role in both T and B cell differentiation, while deregulation or mutation of IKZF1/Ikzf1 is involved in leukemia. Tissue-specific and cell identity genes are usually associated with clusters of enhancers, also called super-enhancers, which are believed to ensure proper regulation of gene expression throughout cell development and differentiation. Several potential regulatory regions have been identified in close proximity of Ikzf1, however, the full extent of the regulatory landscape of the Ikzf1 locus is not yet established. In this study, we combined epigenomics and transcription factor binding along with high-throughput enhancer assay and 4C-seq to prioritize an enhancer element located 120 kb upstream of the Ikzf1 gene. We found that deletion of the E120 enhancer resulted in a significant reduction of Ikzf1 mRNA. However, the epigenetic landscape and 3D topology of the locus were only slightly affected, highlighting the complexity of the regulatory landscape regulating the Ikzf1 locus.


Conflict of interest statement

The authors have declared that no competing interests exist

Figures

Fig 1
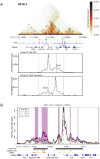
Fig 1. Prioritization of Ikzf1 enhancers.
(A) Epigenomic profiles of the Ikzf1 locus showing ChIP-Seq signals for H3K4me1, H3K27ac and Pol II, DNAseI-seq, Super-enhancers and peaks of the indicated lymphoid transcription factors in mouse primary DP thymocytes. The enhancer activity of DHS regions as assessed by CapStarr-seq in P5424 cells (green: inactive; orange: weak; red: strong; merged from two replicates) is also shown. A strong enhancer associated with six transcription factors is highlighted. Coordinates of DHS and datasets are listed in S3 and S4 Tables, respectively. (B) Ranked DHSs from primary DP thymocytes in the function of enhancer activity assessed by CapStarr-seq in the P5424 cell line (merge of two replicates). The vertical line indicates the top 5% of the most active enhancer. The IkE120 enhancer is highlighted. (C) Enhancer activity of two Ikzf1 enhancers assessed by CapStarr-seq in the P5424 and NIH3T3 cell lines.
Fig 2
Fig 2. 3D topology of the Ikzf1 locus.
(A) Hi-C view of primary DP thymocytes around the Ikzf1 locus (top panel). TAD boundaries are shown. The orientation of the main CTCF peaks in primary DP thymocytes is displayed. Virtual 4C plots corresponding to the Hi-C interactions with the Ikzf1 promoter or the E120 enhancer are shown in the bottom panels. (B) 4C-seq analysis of Ikzf1 promoter interactions. Running mean (window of 21 fragments), quantile normalized 4C-seq profiles are shown from the Ikzf1 promoter bait (dotted line) for primary DN3 (blue) and DP (red) thymocytes and mouse ES cells (green). Locations of genes and the six regions with enhancer activity in CapStarr-seq are shown below the plot. Conserved called interactions with thymic cells are highlighted in purple.
Fig 3
Fig 3. Deletion of the IkE120 enhancer.
(A) Genomic tracks showing the binding peaks of the indicated transcription factors overlapping the IkE120 enhancer in primary DP thymocytes as well as the enhancer activity of individual clones assessed by the CapStarr-seq assay in P5424 cells. The color scale indicates the enhancer activity as a Log2 fold change of the CapStarr-seq signal over the input. The two sgRNAs used to delete the enhancer and primers to detect the deletion are also shown. (B) PCR analyses of IkE120 deletion in the P5424 cell line. (C) Sanger sequencing results from deletion junctions amplified from the genomic DNA of the _targeted ΔIkE120 clone. The rectangles represent the position of the sgRNA. The deleted region is indicated in the bracket. (D) Genomic tracks for RNA-seq and ChIP-seq around the Ikzf1 locus in P5424 cells stimulated or not with PMA/ionomycin (P/I). The IkE120 enhancer is highlighted. The scale of the RNA-seq tracks has been adjusted to visualize the non-coding transcripts overlapping the IkE120 enhancer (a screenshot with unmodified scales for the Ikzf1 gene is shown in S3 Fig) (E) UCSC genome browser showing the transcripts isoforms of the Ikzf1 gene found in RefSeq. (F) RT-qPCR analyses of Ikzf1 expression at the indicated exon-exon junctions in wt and ΔIkE120 P5424 cells. Values represent relative expression as compared with wt samples. (G) Fold induction of Ikzf1 expression (exon 8) after treatment with PMA and ionomycin of P5424 cells. (H) Relative expression of the non-coding transcripts (eRNA) overlapping the IkE120 enhancer in ΔIkE120 cells as compared with wt P5424 samples. Two sets of primers surrounding the IkE120 deleted region were used. In panels F-H, each point represents the means of three independent experiments normalized by the Rpl32 housekeeping gene. Statistical significance was assessed by Student’s t-test (unpaired, two-tailed) from 3 biological replicates (***P < 0.001, **P < 0.01, *P < 0.1). Error bars represent standard deviation.
Fig 4
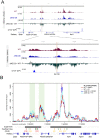
Fig 4. Epigenomic impact of IkE120 deletion.
(A) The H3K27ac ChIP-seq at the Ikzf1 locus (top) and around the IkE120 enhancer (bottom) in wt and ΔIkE120 P5424 cells are shown as individual tracks and as the differential signal between wt and ΔIkE120 cells. The genomic track of CTCF ChIP-seq in primary DP thymocytes is also shown. H3K27ac The IkE120 deleted region is highlighted in red and the promoter region of the neighbor Zpbp gene is highlighted in green. (B) Running mean (window of 21 fragments), quantile normalized 4C-seq profiles are shown from the Ikzf1 promoter bait for wt unstimulated (red), wt stimulated (pink), ΔIkE120 unstimulated (blue) and ΔIkE120 stimulated P5424 cells. Locations of genes and the six regions with enhancer activity in CapStarr-seq are shown below the plot. Conserved called interactions are highlighted in green.

Similar articles

Cited by

References

    1. Plank JL, Dean A. Enhancer Function: Mechanistic and Genome-Wide Insights Come Together. Molecular cell. 2014;55(1):5–14. Epub 2014/07/06. 10.1016/j.molcel.2014.06.015 . - DOI - PMC - PubMed
    1. Pott S, Lieb JD. What are super-enhancers? Nature genetics. 2015;47(1):8–12. Epub 2014/12/31. 10.1038/ng.3167 . - DOI - PubMed
    1. Hnisz D, Shrinivas K, Young RA, Chakraborty AK, Sharp PA. A Phase Separation Model for Transcriptional Control. Cell. 2017;169(1):13–23. Epub 2017/03/25. 10.1016/j.cell.2017.02.007 - DOI - PMC - PubMed
    1. Suzuki HI, Young RA, Sharp PA. Super-Enhancer-Mediated RNA Processing Revealed by Integrative MicroRNA Network Analysis. Cell. 2017;168(6):1000–14 e15. Epub 2017/03/12. 10.1016/j.cell.2017.02.015 - DOI - PMC - PubMed
    1. Bevington SL, Cauchy P, Cockerill PN. Chromatin priming elements establish immunological memory in T cells without activating transcription: T cell memory is maintained by DNA elements which stably prime inducible genes without activating steady state transcription. BioEssays: news and reviews in molecular, cellular and developmental biology. 2017;39(2). Epub 2016/12/28. 10.1002/bies.201600184 . - DOI - PubMed

Publication types

Grants and funding

We thank the Transcriptomics and Genomics Marseille-Luminy (TGML) platform for sequencing the ChIP-seq samples and the Marseille-Luminy cell biology platform for the management of cell culture. Sequencing of 4C samples was performed by the IGBMC GenomEast platform. TGML and GenomEast platforms are member of the France Genomique consortium (ANR-10-INBS-0009). Work in the laboratory of S.S. was supported by recurrent funding from INSERM and Aix-Marseille University and specific grants from the Ligue contre le Cancer (Equipe Labellisée LIGUE 2018), the Agence Nationale pour la Recherche, ANR (ANR-17-CE12-0035; ANR-18-CE12-0019), Cancéropôle PACA, Institut National contre le Cancer (PLBIO018-031 INCA_12619), the Excellence Initiative of Aix-Marseille University - A*Midex, a French “Investissements d’Avenir” programme (ANR-11-IDEX-0001-02). Work in the lab of TS is supported by funds from the European Research Council (ERC) under the European Union’s Horizon 2020 research and innovation program (Starting Grant 678624 - CHROMTOPOLOGY), the ATIP-Avenir program, and the grant ANR-10-LABX-0030-INRT, a French State fund managed by the Agence Nationale de la Recherche under the frame program Investissements d’Avenir ANR-10-IDEX-0002-02. AMM is supported by funds from IDEX (University of Strasbourg) and the Institut National du Cancer. The funders had no role in study design, data collection and analysis, decision to publish, or preparation of the manuscript.
  NODES
innovation 1
Project 1
twitter 2