. 2020 May 17;10(15):6674-6694.
doi: 10.7150/thno.45688. eCollection 2020.

Homotrimer cavin1 interacts with caveolin1 to facilitate tumor growth and activate microglia through extracellular vesicles in glioma

Affiliations

Homotrimer cavin1 interacts with caveolin1 to facilitate tumor growth and activate microglia through extracellular vesicles in glioma

Lin Wang et al. Theranostics. .

Abstract

Background: Intercellular communication via extracellular vesicles (EVs) plays a critical role in glioma progression. However, little is known about the precise mechanism regulating EV secretion and function. Our previous study revealed that Cavin1 was positively correlated with malignancy grades of glioma patients, and that overexpressing Cavin1 in glioma cells enhanced the malignancy of nearby glioma cells via EVs. Methods: The current study used bioinformatics to design a variant Cavin1 (vCavin1) incapable of interacting with Caveolin1, and compared the effects of overexpressing Cavin1 and vCavin1 in glioma cells on EV production and function. Results: Remarkably, our results indicated that Cavin1 expression enhanced the secretion, uptake, and homing ability of glioma-derived EVs. EVs expressing Cavin1 promoted glioma growth in vitro and in vivo. In addition, Cavin1 expressing murine glioma cells recruited and activated microglia via EVs. However, vCavin1 neither was loaded onto EVs nor altered EV secretion and function. Conclusion: Our findings suggested that Cavin1-Caveolin1 interaction played a significant role in regulating production and function of glioma-EVs, and may act as a promising therapeutic _target in gliomas that express high levels of Cavin1.

Keywords: Cavin1-Caveolin1 interaction; extracellular vesicles; glioma; microglia.


Conflict of interest statement

Competing Interests: The authors have declared that no competing interest exists.

Figures
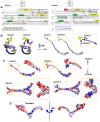
Figure 1
Figure 1
Construction of 3D structures of Cavin1, vCavin1 and Caveolin1 protein. (A) Sequence alignment of human Cavin1 and vCavin1 with high homology templates, respectively. Corresponding domains are shown at the top. The fused TAT short peptide is highlighted by a red arrow. PEST: Pro-Glu-Ser-Thr sequence, LZ: leucine-zipper domain, NLS: nuclear localization sequence. (B) Front and side views of 3D structures of Cavin1 and vCavin1 monomer. The N-terminuses of Cavin1 and vCavin1 were different in structure and orientation. (C) Electrostatic surface view of the monomer and trimer of Cavin1 and vCavin1. Different electrostatic potential in the N-terminus of Cavin1 and vCavin1 monomer or inside the telechelic cavity of Cavin1 and vCavin1 trimer. Blue: cationic; white: electroneutral; red: anionic. (D) Electrostatic surface view of Caveolin1 monomer. The N-terminus of Caveolin1 shows an electrostatic potential matched to the inner surface of the telechelic cavity of Cavin1.
Figure 2
Figure 2
Protein docking and molecular dynamic simulation of Cavin1 and vCavin1 trimer with Caveolin1. (A) Binding conformation analysis of Caveolin1 to Cavin1 and vCavin1, respectively. N-terminus of Caveolin1 fits well in the telechelic cavity of Cavin1. However, vCavin1 bound to Caveolin1 only through external structural adsorption. There was no spatial complementarity and restriction between the two proteins. (B) Electrostatic surface view of the potential binding sites of Cavin1/vCavin1 to Caveolin1. The positive and negative charged regions of Cavin1 and Caveolin1 were well matched. Caveolin1 does not match the electrostatic surface of vCavin1. vCavin1 can only bind to the surface of Caveolin1 through the positively charged region of the segment bending outward, thus the stability of the vCavin1-Caveolin1 complex was weakened to some extent. Blue: cationic; white: electroneutral; red: anionic. Rainbow-colored: Caveolin1. (C) Transmembrane Cavin1-Caveolin1 model constructed using molecular dynamic simulation. Cavin1 was anchored on plasma membrane by binding to Caveolin1. Cyan, pink, and green: homotrimer of Cavin1. Grey: Caveolin1.
Figure 3
Figure 3
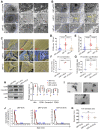
eGFP-Cavin1 interacts with Caveolin1 and was loaded onto EVs of U87 cells. (A) Schematic diagram of the proposed mechanism showing how Cavin1 and vCavin1 affect EV production. (B) WB analysis showing an equal expression level of eGFP-Cavin1 and eGFP-vCavin1 in U87 cells. In addition, the levels of endogenous Cavin1, Caveolin1 and Caveolin2 were not altered by eGFP-Cavin1 and eGFP-vCavin1 expression. (C) IP-WB analysis showing an obvious association of eGFP-Cavin1 with Caveolin1 but no binding between eGFP-vCavin1 and Caveolin1 in U87. (D) WB analysis showing the overexpression of eGFP-Cavin1 in EVs, whereas no eGFP-vCavin1 was detected. Besides, eGFP-Cavin1 and eGFP-vCavin1 expression did not affect levels of endogenous Cavin1, Caveolin1, and Caveolin2 in EVs. (E) Confocal images showing an evident co-localization of eGFP-Cavin1 with Caveolin1 but little co-localization of eGFP-vCavin1 with Caveolin1. (F) Colocalization was quantified and expressed as a Pearson coefficient value. Colocalization of Caveolin1 with eGFP-Cavin1 was significantly higher than with eGFP-vCavin1 (p < 0.0001). (G) Confocal images showing co-localization of eGFP-vCavin1 with Caveolin2 but only little co-localization of eGFP-Cavin1 with Caveolin2. (H) The colocalization of Caveolin2 with eGFP-vCavin1 was higher than with eGFP-Cavin1 (p < 0.001). (I) Confocal images showing co-localization of eGFP-Cavin1 with EEA1. (J) Colocalization of EEA1 with eGFP-Cavin1 was significantly higher than with eGFP-vCavin1 (p < 0.0001).
Figure 4
Figure 4
eGFP-Cavin1 expression enhanced U87-EV production. (A) TEM images showing increased EVs, caveolae and endocytic vesicles in Cavin1 overexpressing U87 cells. The area surrounded by the white dotted line is the cell body, while the area surrounded by the blue dotted line is the extracellular space rich in EVs. Yellow arrowheads represent caveolae and pink arrowheads represent endocytic vesicles. (B) TEM images showing increased MVBs. The areas surrounded by the yellow dotted line are MVBs. (C) SEM images showing abundant EVs attached to the extracellular surface of U87-C. Cell bodies are rendered in yellow, and the EVs attached to the outer surface of the cells are rendered in blue. (D-E) The number of MVBs (per 100 μm2) (D), and the number of EVs (per μm²) of U87-eGFP, U87-C, and U87-vC (E). Data are expressed as the mean ± SEM. (F) EV concentration was expressed as the number of EVs (×108 particles/mL). The concentration of U87-C-EVs was significantly higher than that of U87-EVs and U87-vC-EVs (p < 0.0001; p < 0.0001). (G) EV protein quantification was performed by measuring the total EV protein (μg) per 106 cells. The protein concentration of U87-C-EVs was higher than that of U87-EVs and U87-vC-EVs (p < 0.001; p < 0.01). (H) EVs were isolated from an equal volume of cell culture supernatant and the expression of several proteins in EVs was analyzed. The levels of CD63, Alix, CD81, and Caveolin1 in U87-C-EVs were elevated as compared with that in U87-EVs and U87-vC-EVs (p < 0.0001; p < 0.0001). (I) Representative TEM images showing the morphologies of U87-EVs, U87-C-EVs and U87-vC-EVs. (J) NTA analysis showing a similar particle size distribution of U87-EVs, U87-C-EVs and U87-vC-EVs. (K) No significant difference between the average diameters of U87-EVs, U87-C-EVs and U87-vC-EVs (p > 0.05).
Figure 5
Figure 5
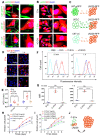
eGFP-Cavin1 expression in U87 increased EV uptake and the proliferation of recipient cells LN229. (A) Confocal images showing the co-culture of LN229-RFP cells with an equal number of U87-eGFP, U87-C, and U87-vC cells, respectively; eGFP-Cavin1 was transferred from U87-C to LN229-RFP cells (the white arrow). (B) Confocal images showing the LN229-RFP cells incubated with an equal concentration of U87-EVs, U87-C-EVs, and U87-vC-EVs, respectively; eGFP-Cavin1 was transferred via EVs to LN229-RFP cells (white arrows). (C) A schematic diagram describing the transfer of eGFP-Cavin1 from U87 to LN229 via EVs, whereas eGFP and eGFP-vCavin1 were not transferred via EVs. (D) Confocal images showing LN229 cells incubated with an equal concentration of Cy5-labeled U87-EVs, U87-C-EVs and U87-vC-EVs for 15 min and 1 h, respectively. (E) Quantitation of the average optical density (AOD) of Cy5 in LN229 cells. At 15 min and 1 h post incubation, cells incubated with U87-C-EVs showed an increased AOD of Cy5 fluorescence. (F) Flow cytometry analysis of Cy5 fluorescence in LN229 cells. (G) Geo Mean fluorescence intensity (MFI) of Cy5 in LN229 cells analyzed through flow cytometry. At 15 min and 1 h post incubation, an increased MFI in cells incubated with U87-C-EVs (15 min: C-EVs vs EVs, p < 0.0001; C-EVs vs vC-EVs, p < 0.0001. 1h: C-EVs vs EVs, p < 0.0001; C-EVs vs vC-EVs, p < 0.0001). (H) CCK8 assay showing an increased cell growth of LN229 treated with U87-C-EVs than those treated with U87-EVs or U87-vC-EVs from day 3 (At day 6, C-EVs vs EVs, p < 0.0001; C-EVs vs vC-EVs, p < 0.0001). (I) The relative cell growth of LN229 treated with a series of increasing concentrations of U87-C-EVs. In a range of 0.05-0.4 mg/mL, as the concentration of U87-C-EVs increased, the proliferation of LN229 exhibited an increasing trend (At day 6, 0.05 mg/mL vs PBS, p < 0.01; 0.1 mg/mL vs 0.05 mg/mL, p < 0.0001; 0.4 mg/mL vs 0.2 mg/mL, p < 0.0001; 1 mg/mL vs 0.4 mg/mL, p > 0.05). (J) A schematic diagram describing efficient internalization of U87-C-EVs by LN229 efficiently and increased LN229 proliferation.
Figure 6
Figure 6
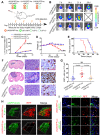
eGFP-Cavin1 was transferred via EVs to recipient LN229 cells and increased LN229 proliferation in orthotopic xenograft glioma mice. (A) Schematic illustration of experimental grouping and process of the mixed glioma xenograft model. U87-eGFP, U87-C, and U87-vC were respectively mixed with an equal number of LN229-RFP-luc and implanted intracranially in nude mice. IVIS detection was performed at day 7, 14, 21, and 28 post-implantation (n = 8), and brains were dissociated at day 21 for histological analysis and confocal imaging. (B) In vivo bioluminescence imaging showing a higher signal intensity in mice implanted with LN229-RFP-luc+U87-C. (C) Analysis of the bioluminescence intensity suggesting a rapidly increasing growth of LN229-RFP-luc which were mixed with U87-C from day 7. (D) Weight analysis indicating a faster weight loss in mice implanted with LN229-RFP-luc+U87-C from day 12 (n = 8). (E) Kaplan-Meier survival curves showing the percent survival of mice implanted with LN229-RFP-luc+U87-eGFP, LN229-RFP-luc+U87-C, and LN229-RFP-luc+U87-vC, respectively (n = 8, p < 0.001; log-rank test). (F) H&E and Ki67 staining of mouse cerebrum with tumor which was harvested at day 21 post implantation (n = 5). H&E staining showing a more heterogeneous composition in the LN229-RFP-luc+U87-C tumor. Scale bar, 100 µm. (G) IHC for Ki67 showing an increased number of Ki67-positive cells in the LN229-RFP-luc+U87-C tumor (mean±SEM, p < 0.0001; p < 0.0001). (H) 3D images generated from the Z-stacks with a slice-distance of 1.6 μm, showing that the number of LN229-RFP-luc cells co-implanted with U87-C were increased and eGFP-Cavin1 was transferred to LN229-RFP-luc (n = 4). (I) Confocal images clearly showing the transfer of eGFP-Cavin1 to LN229-RFP-luc cells (white arrowheads) whereas no transfer of eGFP-vCavin1 was detected in LN229-RFP-luc cells (n = 4).
Figure 7
Figure 7
Systematically applied U87-C-EVs exhibited a homing property towards orthotopic glioma. (A) Schematic representative of the administering of an equal protein amount of Cy5.5-labeled U87-EVs, U87-C-EVs, and U87-vC-EVs to glioma-bearing nude mice via the tail vein. (B) In vivo bioluminescence imaging performed at 21 d post-implantation of glioma cells and in vivo Cy5.5 fluorescence imaging carried out at 2, 6 and 24 h post-EV injection (n = 9). U87-C-EVs accumulated significantly more in mouse brains at 2, 6, and 24 h post-injection. (C) Ex vivo bioluminescence and Cy5.5 fluorescence imaging of mouse brains harvested following the last in vivo imaging (24 h post-injection, n = 4). EVs in the brain accumulated mostly inside glioma. (D) Quantification of Cy5.5 fluorescence intensity in brain showing an increased accumulation of U87-C-EVs in brain than U87-EVs and U87-vC-EVs (p < 0.001; p < 0.01). (E) Confocal images of glioma tissues harvested at 24 h post-injection of PBS, Cy5.5 labeled U87-EVs, U87-C-EVs and U87-vC-EVs (n = 5). Cy5.5 positive glioma cells indicated that the Cy5.5-labeled EVs were internalized by these cells (white arrowheads). (F) Quantification of the number of Cy5.5 positive cells per 104 μm in glioma tissue. U87-C-EVs showed more internalization in glioma cells than U87-EVs and U87-vC-EVs (p < 0.0001; p < 0.0001).
Figure 8
Figure 8
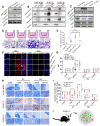
eGFP-Cavin1 overexpressing murine glioma cells GL261 secreted EVs leading to recruitment and activation of microglia. (A) WB analysis of the expression of eGFP-Cavin1, endogenous Cavin1, Caveolin1, and Caveolin2 in GL261-eGFP, GL261-C, and GL261-vC cells; eGFP-Cavin1 or eGFP-vCavin1 expression did not alter the expression level of endogenous Cavin1. However, Caveolin1 and Caveolin2 levels increased in cells expressing eGFP-Cavin1. (B) IP-WB analysis showing an obvious association between eGFP-Cavin1 and Caveolin1 but no binding between eGFP-vCavin1 and Caveolin1 in GL261. (C) WB analysis of the expression of eGFP-Cavin1, Caveolin1, Caveolin2, CD63, CD81, and Alix in GL261-EVs, GL261-C-EVs, and GL261-vC-EVs; eGFP-Cavin1 showed a high expression level whereas eGFP-vCavin1 was not detected in EVs. In addition, Caveolin1 and Caveolin2 levels were not affected by eGFP-Cavin1 and eGFP-vCavin1 expression. (D) Representative images of migrated BV2 cells induced by an equal concentration of GL261-EVs, GL261-C-EVs or GL261-vC-EVs in the transwell migration assay. Scale bar, 200 μm. (E) Quantification of the number of migrated BV2 cells. GL261-C-EVs induced an increase in the number of migrated BV2 cells as compared with GL261-EVs and GL261-vC-EVs (p < 0.001; p < 0.001). Compared with the Control group, GL261-EVs and GL261-vC-EVs both increased the migrated cell number (p < 0.05; p < 0.05). (F) Confocal immunofluorescence images of BV2 cells treated for 48 h with an equal concentration of GL261-EVs, GL261-C-EVs and GL261-vC-EVs, respectively, showing the expression of M1 markers (CD86; MHCⅡ) and M2 markers (CD206; CD163) in BV2 cells. (G) Quantification of the GeoMean Fluorescence Intensity (MFI) of CD86, MHC Ⅱ, CD206 and CD163. The MFI of M1 markers (CD86; MHCⅡ) and M2 markers (CD206; CD163) increased in BV2 cells treated with GL261-C-EVs. CD86: GL261-C-EVs vs GL261-EVs, p < 0.0001; GL261-C-EVs vs GL261-vC-EVs, p < 0.0001. MHCⅡ: GL261-C-EVs vs GL261-EVs, p < 0.0001; GL261-C-EVs vs GL261-vC-EVs, p < 0.0001. CD163: GL261-C-EVs vs GL261-EVs, p < 0.0001; GL261-C-EVs vs GL261-vC-EVs, p < 0.0001. CD206: GL261-C-EVs vs GL261-EVs, p < 0.0001; GL261-C-EVs vs GL261-vC-EVs, p < 0.0001. (H) IHC images showing the expression of CD68, CD86, MHCⅡ, CD206, and CD163 in the glioma tissue of C57BL/6 mice which were implanted with GL261-eGFP, GL261-C, and GL261-vC cells, respectively (n = 6). (I) Quantification of the number of CD68, CD86, MHCⅡ, CD206, and CD163 positive cells in glioma tissue. CD68, CD86, MHCⅡ, CD206, and CD163 positive cells were increased in GL261-C glioma as compared with GL261-eGFP and GL261-vC gliomas. CD68: GL261-C vs GL261-eGFP, p < 0.001; GL261-C vs GL261-vC, p < 0.0001. CD86: GL261-C vs GL261-eGFP, p < 0.0001; GL261-C vs GL261-vC, p < 0.0001. MHCⅡ: GL261-C vs GL261-eGFP, p < 0.05; GL261-C vs GL261-vC, p < 0.0001. CD206: GL261-C vs GL261-eGFP, p < 0.01; GL261-C vs GL261-vC, p < 0.01. CD163: GL261-C vs GL261-eGFP, p < 0.01; GL261-C vs GL261-vC, p < 0.05. (J) Schematic illustration of increased infiltration of activated microglia/macrophages in GL261-C glioma.

Similar articles

Cited by

References

    1. Schwager SC, Taufalele PV, Reinhart-King CA. Cell-Cell Mechanical Communication in Cancer. Cell Mol Bioeng. 2019;12:1–14. - PMC - PubMed
    1. Trajkovic K, Hsu C, Chiantia S, Rajendran L, Wenzel D, Wieland F. et al. Ceramide triggers budding of exosome vesicles into multivesicular endosomes. Science. 2008;319:1244–1247. - PubMed
    1. Thery C, Zitvogel L, Amigorena S. Exosomes: composition, biogenesis and function. Nat Rev Immunol. 2002;2:569–579. - PubMed
    1. Broekman ML, Maas SLN, Abels ER, Mempel TR, Krichevsky AM, Breakefield XO. Multidimensional communication in the microenvirons of glioblastoma. Nat Rev Neurol. 2018;14:482–495. - PMC - PubMed
    1. Pinet S, Bessette B, Vedrenne N, Lacroix A, Richard L, Jauberteau MO. et al. TrkB-containing exosomes promote the transfer of glioblastoma aggressiveness to YKL-40-inactivated glioblastoma cells. Onco_target. 2016;7:50349–50364. - PMC - PubMed

Publication types

MeSH terms

  NODES
admin 1
Association 2
INTERN 6
twitter 2