. 2021 Jul;17(7):1729-1752.
doi: 10.1080/15548627.2020.1783118. Epub 2020 Jul 1.

RETREG1/FAM134B mediated autophagosomal degradation of AMFR/GP78 and OPA1 -a dual organellar turnover mechanism

Affiliations

RETREG1/FAM134B mediated autophagosomal degradation of AMFR/GP78 and OPA1 -a dual organellar turnover mechanism

Debdatto Mookherjee et al. Autophagy. 2021 Jul.

Abstract

Turnover of cellular organelles, including endoplasmic reticulum (ER) and mitochondria, is orchestrated by an efficient cellular surveillance system. We have identified a mechanism for dual regulation of ER and mitochondria under stress. It is known that AMFR, an ER E3 ligase and ER-associated degradation (ERAD) regulator, degrades outer mitochondrial membrane (OMM) proteins, MFNs (mitofusins), via the proteasome and triggers mitophagy. We show that destabilized mitochondria are almost devoid of the OMM and generate "mitoplasts". This brings the inner mitochondrial membrane (IMM) in the proximity of the ER. When AMFR levels are high and the mitochondria are stressed, the reticulophagy regulatory protein RETREG1 participates in the formation of the mitophagophore by interacting with OPA1. Interestingly, OPA1 and other IMM proteins exhibit similar RETREG1-dependent autophagosomal degradation as AMFR, unlike most of the OMM proteins. The "mitoplasts" generated are degraded by reticulo-mito-phagy - simultaneously affecting dual organelle turnover.Abbreviations: AMFR/GP78: autocrine motility factor receptor; BAPTA: 1,2-bis(o-aminophenoxy)ethane-N,N,N',N'-tetraacetic acid; BFP: blue fluorescent protein; CCCP: carbonyl cyanide m-chlorophenyl hydrazone; CNBr: cyanogen bromide; ER: endoplasmic reticulum; ERAD: endoplasmic-reticulum-associated protein degradation; FL: fluorescence, GFP: green fluorescent protein; HA: hemagglutinin; HEPES: 4-(2-hydroxyethyl)-1-piperazineethanesulfonic acid; IMM: inner mitochondrial membrane; LIR: LC3-interacting region; MAP1LC3/LC3: microtubule associated protein 1 light chain 3; MFN: mitofusin, MGRN1: mahogunin ring finger 1; NA: numerical aperature; OMM: outer mitochondrial membrane; OPA1: OPA1 mitochondrial dynamin like GTPase; PRNP/PrP: prion protein; RER: rough endoplasmic reticulum; RETREG1/FAM134B: reticulophagy regulator 1; RFP: red fluorescent protein; RING: really interesting new gene; ROI: region of interest; RTN: reticulon; SEM: standard error of the mean; SER: smooth endoplasmic reticulum; SIM: structured illumination microscopy; SQSTM1/p62: sequestosome 1; STED: stimulated emission depletion; STOML2: stomatin like 2; TOMM20: translocase of outer mitochondrial membrane 20; UPR: unfolded protein response.

Keywords: AMFR/GP78; OPA1; RETREG1/FAM134B; autophagy; mitoplast; reticulo-mito-phagy.


Conflict of interest statement

The authors declare no conflict of interest, financial or otherwise.

Figures
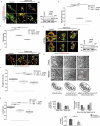
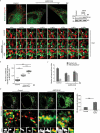
Figure 1.
Figure 1.
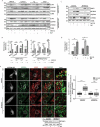
High levels of AMFR induce “mitoplast” formation. (A) HeLa cells transfected with AMFR-FLAG or EmpVec along with mito-BFP and TOMM20-mCherry were either treated with Baf or left untreated and imaged under live-cell conditions. Control cells were left untreated. Images are single slices from z-stacks. Note: detection of mitoplasts in the presence of AMFR as indicated by white arrowheads. ~85 cells from 6 independent experiments were analyzed. Immunoblot of the lysates post imaging were probed with anti-FLAG and anti-VCL antibodies confirm AMFR transfection and loading. Scale bar: 5 μm. (B and C) Box plot representations of the neighborhood index (B) and overlap index (C) of TOMM20-mCherry structures representing OMM within close proximity (roughly 47 nM radius neighborhood) of the IMM boundary marked by mito-BFP signal; analyses of images in panel A. The central line and the plus (+) symbol in each box show the median and mean value, respectively. *** p ≤ 0.001 using unpaired 2-tailed Student’s t-test. (D) Cells similarly transfected and treated as in panel A were imaged live in the slice 3D-SIM mode; mito-GFP was used instead of mito-BFP. Images are 3D-projections obtained from z-stacks using ImageJ. Mitoplasts indicated by white arrowheads. Note that rotating the reconstructed images by 60° angle confirmed absence of TOMM20-mCherry signal from the mito-GFP-positive “mitoplasts”. ~30 cells from 3 independent experiments were analyzed Immunoblot of the lysates post imaging were probed with anti-FLAG and anti-VCL antibodies confirm AMFR transfection and loading. Scale bar: 5 μm. (E) Enlarged views of a portion of the middle slices from images represented in panel D. Scale bar: 1 μm. Note the presence of “mitoplasts” (white arrowheads), “hollow vesicle-like outer membranes (yellow arrowheads)” and “mitochondria with partial OMM (cyan arrowheads)” – the three phenotypes of unstable mitochondria. Enhanced detection of these events in presence of Baf. (F and G) Image analyses similar to panels B and C done with the 3D-SIM data also revealed similar trend of fewer TOMM20-mCherry-positive structures near close vicinity and or overlaying the mito-GFP boundary cells overexpressing AMFR as compared to control. *** p ≤ 0.001 using unpaired 2-tailed Student’s t-test. (H) Representative transmission electron micrographs of cells transfected with EmpVec (i–iii) or AMFR (iv–vi). White arrowheads indicate ER-mitochondria junctions (i and iii); Fg denotes “fragmented outer mitochondrial membrane” (iv); arrow marks “OMM peeling off” (v); and red arrowheads indicate “ER phagophore with internalized mitochondria” (vi). Red dotted line demarcates the boundary of the ER phagophore. Note increased events of “unstable mitochondria” in AMFR-IRES-GFP-expressing sorted cells. (I) Mitochondrial length (major and minor axes) and eccentricity calculated from the electron micrographs of cells transfected with EmpVec and AMFR using image processing toolbox of MATLAB. * p ≤ 0.05, using unpaired 2-tailed Student’s t-test. Error bars, ±SEM
Figure 2.
Figure 2.
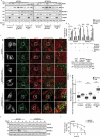
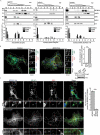
Autophagic degradation of AMFR is mediated by RETREG1. (A) HeLa cells transfected with AMFR-FLAG or AMFR∆IQ-FLAG were subjected to treatments with indicated drugs, lysed and analyzed by western blots for the levels of AMFR. Protein levels of CTNNB1 and SQSTM1 were used for verifying whether at the given doses MG132 and bafilomycin A1 block the proteasomal and autophagosomal pathways, respectively. TUBB was used as the loading control. (B) Histogram plotted with data from panel A was from 3 independent experiments. n.s-Not significant (p = 0.4,0.4,0.08), * p ≤ 0.05, ** p ≤ 0.01, *** p ≤ 0.001, using unpaired 2-tailed Student’s t-test. Error bars, ±SEM. (C) MOCK siRNA or RETREG1 siRNA transfected cells were treated with the indicated drugs. AMFR levels were analyzed by western blots. Note similar enrichment of proteins in cells with MOCKsiRNAs upon drug treatment. RETREG1, CTNNB1, SQSTM1 and TUBB were used as controls. (D) Graph plotted with analyses of panel C. Data represents 5 independent experiments. * p ≤ 0.05, ** p ≤ 0.01, using unpaired 2-tailed Student’s t-test. Error bars, ±SEM. (E) Cells transfected with similar siRNAs as in panel C were subjected to Baf treament or left untreated, immunostained with antibodies against AMFR and SQSTM1, and imaged. The ER was marked by CyTERM-BFP. Images are 3D-projections obtained from z-stacks using ImageJ. Enlarged views of the areas within the white boxes are also shown (insets); arrowheads indicate colocalization between AMFR and SQSTM1. Efficiency of RETREG1 depletion was verified by immunoblotting; VCL was used as loading control. Scale bar: 5 μm. (F) Images from panel E were analyzed by using the Coloc2 plugin in Fiji to calculate Mander’s coefficient that measures SQSTM1 pixels, which were also positive for AMFR in 120 ROIs taken from 85 cells over 5 independent experiments. n.s-Not significant (p = 0.55), ***p < 0.001, using unpaired 2-tailed Student’s t-test
Figure 3.
Figure 3.
LC3 binding motif of RETREG1 is essential for autophagic degradation of AMFR. (A) MOCK or RETREG1 siRNAs-treated HeLa cells were transfected with RETREG1-HA, FAM134ΔLIR-HA or control vectors. Cells were then treated with the indicated drugs, lysed and immunoblotted against AMFR. Note: elevated levels of AMFR in Baf-treated RETREG1-HA-expressing cells unlike the other sets where the E3 ligase was enriched in MG132 samples. HA, RETREG1, SQSTM1 and TUBB were used as controls. The difference in migration pattern of RETREG1ΔLIR-HA is likely due to the presence of negatively charged amino acid residues when compared with RETREG1-HA. Antibody against RETREG1 could not detect HA-tagged RETREG1 or RETREG1ΔLIR. (B) The fold-changes in AMFR from data analyzed in panel A plotted from 8 independent experiments. n.s-Not significant (p > 0.7), * p ≤ 0.05, ** p ≤ 0.01 using unpaired 2-tailed Student’s t-test. Error bars, ±SEM. (C) Cells similarly treated as in panel A were transfected with CyTERM-BFP and immunostained for AMFR and SQSTM1, and imaged. Images are 3D-projections obtained from z-stacks using ImageJ. Enlarged views of the areas within the white boxes are also shown (insets); colocalization between the two proteins indicated by arrowheads. Transfection efficiencies of RETREG1-HA and RETREG1ΔLIR-HA were confirmed by immunoblotting with anti-HA antibody; VCL was used as loading control. Scale bar: 5 μm. (D) Graph representing the number of AMFR-positive SQSTM1 puncta per cell was plotted with data from panel C. Mander’s coefficient represents the fraction of SQSTM1-positive puncta that were positive for AMFR in 135 ROIs taken from 80 cells over 4 independent experiments. n.s-Not significant (p = 0.15), *p < 0.05, ***p < 0.001, using unpaired 2-tailed Student’s t-test. (E) Lysates from cells transiently transfected with MOCKsiRNAs or RETREG1siRNAs and treated with cycloheximide (Chx, 100 μg/ml) for indicated periods of time. Western blot analyses show change in AMFR levels across samples over time. The levels of TOMM20, RETREG1 and TUBB serve as loading controls. (F) Graph quantifying these data shows results from 3 independent experiments. Error bars, ±SEM. The significance was calculated between each data point (n) and (n-1). n.s-Not significant, *p < 0.05, **p < 0.01, using unpaired 2-tailed Student’s t-test. Note that with RETREG1 knockdown, change in AMFR levels were not significant (with 0.07 ≥ p ≤ 0.8)
Figure 4.
Figure 4.
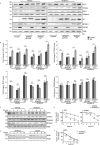
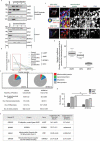
LC3 binding motif of RETREG1 is essential for autophagic degradation of IMM proteins. (A) MOCK or RETREG1 siRNAs-treated HeLa cells were transfected with RETREG1-HA, RETREG1ΔLIR-HA or control vectors. Cells were then treated with Baf or left untreated, lysed and immunoblotted against the indicated antibodies. Note: exogenous expression of RETREG1-HA in cells depleted with siRNAs against RETREG1 rescued the expression patterns of mitochondrial proteins similar to controls. HA, RETREG1, SQSTM1 and TUBB served as controls. (B) Graphs indicate fold-change of all mitochondrial proteins analyzed in panel A. Data analyzed from 7 independent experiments. n.s- Not significant (p > 0.2 for OPA1, p > 0.5 for STOML2, p ≥ 0.2 for MFN1, p ≥ 0.1 for TOMM20. * p ≤ 0.05 using unpaired 2-tailed Student’s t-test. Error bars, ±SEM. (C) Similar experiment as in Figure 3 panel E was performed to check for the protein levels of OPA1 and STOML2 by western blot analyses across samples over time. The levels of TOMM20, RETREG1 and TUBB serve as loading controls. (D) Graphs quantifying these show results from 3 independent experiments. Error bars, ±SEM. The significance was calculated between each data point (N) and (n-1). n.s-Not significant, *p < 0.05, ***p < 0.001, using unpaired 2-tailed Student’s t-test. Note that with RETREG1 knockdown, change in OPA1 levels were not significant (with 0.1 ≥ p ≤ 0.3), change in STOML2 also followed a slower kinetics. (E) Similar experiment as in panel C was performed for the indicated periods of time to validate the protein levels of MFN1. TUBB serves asloading control. (F) Graph quantifying results from panel E. Data represents 3 independent experiments. Error bars, ±SEM. The significance was calculated as in panel D. n.s-Not significant, using unpaired 2-tailed Student’s t-test. Note that with REGREG1 knockdown, change in MFN1 levels was not significant (with 0.1 ≥ p ≤ 0.3)
Figure 5.
Figure 5.
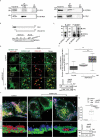
RETREG1 and OPA1 interact during reticulo-mitophagy. (A) Mouse brain lysates were immunoprecipitated with indicated antibodies. Western blot analyses show co-immunoprecipitation of endogenous RETREG1 with OPA1. Reverse co-immunoprecipitations validate the interaction. IP indicates “immunoprecipitate”. Proportion of lysate loaded as input and used for immunoprecipitation are denoted in brackets by ‘X’. (B) Line diagram showing the part of full-length OPA1 that was deleted to generate the recombinant OPA1ΔN114. A detergent lysate of normal adult mouse brain was passed over immobilized BSA or recombinant OPA1ΔN114, and the bound products, along with different amounts of input brain lysate, were analyzed by immunoblot for RETREG1. (C) For in vitro co-immunoprecipitation, bacterial pellet lysate with recombinant full-length His-tagged RETREG1 was combined with recombinant OPA1ΔN114 (refer Materials and Methods). Note that reverse co-immunoprecipitation validates interaction. Since bacterial pellets were used as the source for the recombinant full-length RETREG1, this reticulon family protein was in an enriched but not pure form. Perhaps, due to this, a bacterial periplasmic folding chaperone with an inactive PPIase domain (~63 kDa) from the E. coli BL21 (DE3) was also co-immunoprecipitated. ← periplasmic protein in bacteria, recombinant RETREG1 and OPA1ΔN114. (D) HeLa cells were transfected with RETREG1-GFP and OPA1-RFP along with EmpVec or AMFR-FLAG. Note: increased colocalization between the two proteins upon overexpression of AMFR. Enlargedviews of the images (insets) are also shown; Baf treatment enhances this effect. Vesicles indicated by arrowheads (yellow – colocalization between RETREG1-GFP and OPA1-RFP, cyan – partial overlap, and white – no colocalization). AMFR expression was verified by immunoblotting; VCL was used as loading control. Scale bar: 5 μm. Note an abundance of white arrowheads in the control shows lack of colocalization between RETREG1-GFP and OPA1-RFP; AMFR overexpression leads to increase in partial (cyan) or complete (yellow) overlap between the two signals. (E) Images from panel D were analyzed by using the Coloc2 plugin in Fiji to calculate Mander’s coefficient that measures RETREG1-GFP pixels, which were also positive for OPA1-RFP in 180 ROIs taken from ~93 cells over 5 independent experiments. ***p < 0.001, using unpaired 2-tailed Student’s t-test. (F) Cells transfected with AMFR-FLAG or EmpVec along with RETREG1-GFP, mito-BFP and TOMM20-mCherry were either treated with Baf or left untreated and imaged under live-cell conditions. Control cells were left untreated. Images are 3D-projections obtained from z-stacks using ImageJ. Co-expression of RETREG1-GFP (ER), mito-BFP (IMM) indicated by white arrowheads. ~75 cells from 5 independent experiments were analyzed. Immunoblot of the lysates post imaging were probed with anti-FLAG and anti-VCL antibodies confirm AMFR transfection and loading. Bottom panel depicts snapshots of 3D reconstructed images generated by rotating them ~90° on the Y-axis; cells numbered for ease of visualization. Scale bar: 5 μm. (G) Box plot representations of the neighborhood index of RETREG1-GFP structures representing ER within close proximity (roughly 94 nM radius neighborhood) of the IMM boundary marked by mito-BFP signal, analyses of images in panel A. *** p ≤ 0.001 using unpaired 2-tailed Student’s t-test
Figure 6.
Figure 6.
ER forms mitophagophore around “mitoplasts”. (A) Cells transfected with AMFR-FLAG or EmpVec along with RETREG1-GFP and mito-RFP were either treated with Baf or left untreated and imaged under live-cell conditions for 5 min. Control cells were left untreated. Enlarged views of the areas within the white boxes over the indicated time-points are also shown. Contact between RETREG1-GFP and mito-RFP indicated by white arrowheads. Note the successful formation of mitophagophore by ER in the presence of AMFR. Immunoblot of the lysates post-imaging were probed with anti-FLAG and anti-VCL antibodies confirm AMFR transfection and loading. ~35 cells from 3 independent experiments were analyzed. Scale bar: 5 μm. (B) Mander’s coefficient shows the fraction of mito-RFP positive for RETREG1-GFP in 90 ROIs. ***p < 0.001, using unpaired 2-tailed Student’s t-test. (C) Graph showing the number of indicated events per cell over 5 min from cells analyzed in panel A was plotted. (D) Cells transfected with AMFR-FLAG or EmpVec along with RETREG1-HA and OPA1-GFP were fixed, immunostained and imaged by STED super-resolution microsopy. Enlarged views of the areas within the white boxes are indicated. Note: increased presence of ER-mitophagophores in cells with AMFR as marked by white arrowheads. 8 cells from 2 independent experiments were imaged. Right panel for each cell depicts 2D reconstructed images; RETREG1 in green (ER), OPA1 in red (mitochondria) and overlap between the two in purple. Scale bar: 1 μm. (E) Histogram plotting the ER ratio around mitochondria was plotted by analyzing STED images. At least 400 mitochondria were analyzed. *** p ≤ 0.001 using unpaired 2-tailed Student’s t-test
Figure 7.
Figure 7.
AMFR and IMM proteins are located in autophagosomes. (A) Cos7 cells treated with MOCK or RETREG1 siRNAs for 48 h were transfected with RETREG1-HA or control vector, followed by Baf treatment. All samples were fractionated using a 60% iodixanol (OptiPrep) gradient. Fractions of 450 μl (lanes numbered 1 through 9) were collected from the bottom to the top. Fractions were immunoblotted against LC3, RETREG1 (or HA), OPA1, MFN1 and AMFR. Note that RETREG1-depleted cells have less AMFR and OPA1 in LC3-positive fractions, these proteins could again be detected upon exogenous expression of RETREG1-HA; MFN1 detected only in whole-cell lysate (In). Distribution of LC3 was similar across the 3 samples. Graphs show the distribution of the proteins RETREG1, OPA1, AMFR and MFN1 in the samples normalized to LC3 levels; the numbers in the graphs correspond to the lane numbers in the blots above. Data represent means ±SEM from 3 independent experiments. Antibody against RETREG1 could not detect HA-tagged RETREG1; hence antibody against HA was used for the rescue experiment with RETREG1-HA. (B) Cells transfected with RETREG1-GFP and mCherry-LC3 along with AMFR-FLAG or EmpVec were immunostained against OPA1 and imaged. Histogram plotting the number of puncta per cell positive for OPA1, LC3 and RETREG1. Immunoblot of the lysates post imaging were probed with anti-FLAG and anti-VCL antibodies confirm AMFR transfection and loading. ~35 cells from 4 independent experiments were analyzed. Error bars, ±SEM. ** p ≤ 0.01 using unpaired 2-tailed Student’s t-test. Scale bar: 5 μm. (C) Cells transfected with AMFR-FLAG and GFP-LC3 along with HA-tagged RETREG1 or RETREG1ΔLIR were immunostained against HA and OPA1, and imaged. Histogram plotting the number of puncta per cell positive for OPA1, LC3 and RETREG1. ~40 cells from 5 independent experiments were analyzed. Error bars, ±SEM. Note lesser number of vesicles positive for all three proteins in cells with RETREG1ΔLIR. ** p ≤ 0.01 using unpaired 2-tailed Student’s t-test. Scale bar: 5 μm
Figure 8.
Figure 8.
AMFR and IMM proteins are detected in lysosomes. (A) HeLa cells either treated combinatorially with 10 μM leupeptin, 10 μM pepstatin A and 1 μM E64D for 24 h or left untreated were lysed, fractionated to enrich lysosomes and analyzed by western blots for the indicated proteins. Input – unfractionated whole-cell lysate. (B) The scatter plot gives a graphical overview of the amount of proteins in the respective fractions for AMFR, OPA1, RETREG1, and LAMP1 under the experimental conditions in panel A. The red box marks the lysosome-enriched fractions. ‘Lyso blockers’ denotes combinatorial drug treatment to block lysosomal activity. (C) Pie charts and table depicting mass spectrometric analyses of abundance of various proteins in lysosome-enriched fractions from MOCK or RETREG1 siRNAs-treated cells. (D) Histogram plotting the number of different mitochondrial proteins based on their localization. ** p ≤ 0.01, using unpaired 2-tailed Student’s t-test. Error bars, ±SEM. (E) MaxQuant was used to identify proteins from the peptides generated in the mass spectrometric analyses. Mean LFQ intensities were transformed to log base 2 and standard deviation between data sets was calculated using Perseus [96]. Table shows comparison of LFQ intensities of indicated proteins between MOCK and RETREG1 siRNA-treated cells. Data represent 3 independent experiments. Error represents standard deviation between sets. (F) HeLa cells transfected with OPA1-GFP or MFN1-YFP along with AMFR-FLAG were fixed, immunostained for FLAG and CD63, and imaged. Images are 3D-projections obtained from z-stacks using ImageJ. Enlarged views of the areas within the white boxes are also shown (insets). AMFR-FLAG-positive CD63 puncta with OPA1-GFP are indicated by white arrowheads. Cartoon depicts method for scoring protein colocalization. Note that while AMFR-FLAG-positive CD63 puncta are present under both experimental conditions, MFN1-YFP was not detected in these structures. Scale bar: 15 μm. (G) Graph plotting Mander’s coefficient to show the fraction of CD63-positive puncta also positive for AMFR, OPA1 (IMM) and MFN1 (OMM)
Figure 9.
Figure 9.
Summary cartoon. Schematic diagram summarizing the results. Under conditions of stress, when the levels of AMFR are high, loss of OMM proteins destabilizes the mitochondria. RETREG1 interacts with OPA1 (at the IMM) and utilizes its LIR motif to assemble a phagophore around the mitochondria. Excess AMFR also gets degraded along with the “mitoplasts” at the lysosomes by this specialized “reticulo-mito-phagy” process

Similar articles

Cited by

References

    1. Mizushima N.Autophagy: process and function. Genes Dev. 2007;21:2861–2873. - PubMed
    1. Mizushima N. The pleiotropic role of autophagy: from protein metabolism to bactericide. Cell Death Differ. 2005;12:1535–1541. - PubMed
    1. Rubinsztein DC, Codogno P, Levine B. Autophagy modulation as a potential therapeutic _target for diverse diseases. Nat Rev Drug Discov. 2012;11:709–730. - PMC - PubMed
    1. Lamb CA, Yoshimori T, Tooze SA. The autophagosome: origins unknown, biogenesis complex. Nat Rev Mol Cell Biol. 2013;14:759–774. - PubMed
    1. Graef M, Friedman JR, Graham C, et al. ER exit sites are physical and functional core autophagosome biogenesis components. Mol Biol Cell. 2013;24:2918–2931. - PMC - PubMed

Publication types

Substances

Grants and funding

This work was supported by the CSIR – Indian Institute of Chemical Biology [Intramural]; Council of Scientific and Industrial Research, India [Fellowship]; Department of Atomic Energy, Government of India [IBOP]; Science and Engineering Research Board [EMR/2016/002706]; University Grants Commission [F2-32/1998 (SA-1)].
  NODES
INTERN 1
Note 21
Project 5
twitter 2
Verify 1