Ancestry effects on type 2 diabetes genetic risk inference in Hispanic/Latino populations
- PMID: 32580712
- PMCID: PMC7315475
- DOI: 10.1186/s12881-020-01068-0
Ancestry effects on type 2 diabetes genetic risk inference in Hispanic/Latino populations
Abstract
Background: Hispanic/Latino (HL) populations bear a disproportionately high burden of type 2 diabetes (T2D). The ability to predict T2D genetic risk using polygenic risk scores (PRS) offers great promise for improved screening and prevention. However, there are a number of complications related to the accurate inference of genetic risk across HL populations with distinct ancestry profiles. We investigated how ancestry affects the inference of T2D genetic risk using PRS in diverse HL populations from Colombia and the United States (US). In Colombia, we compared T2D genetic risk for the Mestizo population of Antioquia to the Afro-Colombian population of Chocó, and in the US, we compared European-American versus Mexican-American populations.
Methods: Whole genome sequences and genotypes from the 1000 Genomes Project and the ChocoGen Research Project were used for genetic ancestry inference and for T2D polygenic risk score (PRS) calculation. Continental ancestry fractions for HL genomes were inferred via comparison with African, European, and Native American reference genomes, and PRS were calculated using T2D risk variants taken from multiple genome-wide association studies (GWAS) conducted on cohorts with diverse ancestries. A correction for ancestry bias in T2D risk inference based on the frequencies of ancestral versus derived alleles was developed and applied to PRS calculations in the HL populations studied here.
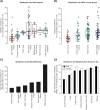
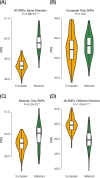
Results: T2D genetic risk in Colombian and US HL populations is positively correlated with African and Native American ancestry and negatively correlated with European ancestry. The Afro-Colombian population of Chocó has higher predicted T2D risk than Antioquia, and the Mexican-American population has higher predicted risk than the European-American population. The inferred relative risk of T2D is robust to differences in the ancestry of the GWAS cohorts used for variant discovery. For trans-ethnic GWAS, population-specific variants and variants with same direction effects across populations yield consistent results. Nevertheless, the control for bias in T2D risk prediction confirms that explicit consideration of genetic ancestry can yield more reliable cross-population genetic risk inferences.
Conclusions: T2D associations that replicate across populations provide for more reliable risk inference, and modeling population-specific frequencies of ancestral and derived risk alleles can help control for biases in PRS estimation.
Keywords: Antioquia; Chocó; Colombia; Genetic ancestry; Genetic risk; Hispanic/Latino (HL); Polygenic risk score (PRS); Population genetics; Type 2 diabetes (T2D).
Conflict of interest statement
The authors declare that they have no competing interests.
Figures


Similar articles
-
Influence of genetic ancestry and socioeconomic status on type 2 diabetes in the diverse Colombian populations of Chocó and Antioquia.Sci Rep. 2017 Dec 7;7(1):17127. doi: 10.1038/s41598-017-17380-4. Sci Rep. 2017. PMID: 29215035 Free PMC article.
-
The Phenotypic Consequences of Genetic Divergence between Admixed Latin American Populations: Antioquia and Chocó, Colombia.Genome Biol Evol. 2020 Sep 1;12(9):1516-1527. doi: 10.1093/gbe/evaa154. Genome Biol Evol. 2020. PMID: 32681795 Free PMC article.
-
A Comparative Analysis of Genetic Ancestry and Admixture in the Colombian Populations of Chocó and Medellín.G3 (Bethesda). 2017 Oct 5;7(10):3435-3447. doi: 10.1534/g3.117.1118. G3 (Bethesda). 2017. PMID: 28855283 Free PMC article.
-
Progress in Defining the Genetic Contribution to Type 2 Diabetes in Individuals of East Asian Ancestry.Curr Diab Rep. 2021 Apr 13;21(6):17. doi: 10.1007/s11892-021-01388-2. Curr Diab Rep. 2021. PMID: 33846905 Review.
-
Genetics of Type 2 Diabetes: Implications from Large-Scale Studies.Curr Diab Rep. 2022 May;22(5):227-235. doi: 10.1007/s11892-022-01462-3. Epub 2022 Mar 19. Curr Diab Rep. 2022. PMID: 35305202 Free PMC article. Review.
Cited by
-
Genetic European Ancestry and Incident Diabetes in Black Individuals: Insights From the SPRINT Trial.Circ Genom Precis Med. 2022 Feb;15(1):e003468. doi: 10.1161/CIRCGEN.121.003468. Epub 2022 Jan 28. Circ Genom Precis Med. 2022. PMID: 35089798 Free PMC article. Clinical Trial.
-
Increased Carotid Intima-Media Thickness in Asymptomatic Individuals Is Associated with the PCSK9 (rs2149041) Gene Polymorphism in the Mexican Mestizo Population: Results of the GEA Cohort.Life (Basel). 2022 Sep 30;12(10):1531. doi: 10.3390/life12101531. Life (Basel). 2022. PMID: 36294964 Free PMC article.
-
Type 2 Diabetes Mellitus in Latinx Populations in the United States: A Culturally Relevant Literature Review.Cureus. 2022 Mar 15;14(3):e23173. doi: 10.7759/cureus.23173. eCollection 2022 Mar. Cureus. 2022. PMID: 35444916 Free PMC article. Review.
-
Decoding the genetic relationship between Alzheimer's disease and type 2 diabetes: potential risk variants and future direction for North Africa.Front Aging Neurosci. 2023 Jun 5;15:1114810. doi: 10.3389/fnagi.2023.1114810. eCollection 2023. Front Aging Neurosci. 2023. PMID: 37342358 Free PMC article.
-
Socioeconomic deprivation and genetic ancestry interact to modify type 2 diabetes ethnic disparities in the United Kingdom.EClinicalMedicine. 2021 Jun 14;37:100960. doi: 10.1016/j.eclinm.2021.100960. eCollection 2021 Jul. EClinicalMedicine. 2021. PMID: 34386746 Free PMC article.
References
-
- van Dieren S, Beulens JW, van der Schouw YT, Grobbee DE, Neal B. The global burden of diabetes and its complications: an emerging pandemic. Eur J Cardiovasc Prev Rehabil. 2010;17(Suppl 1):S3–S8. - PubMed
-
- IDF Diabetes Atlas, 8th Edition [http://www.diabetesatlas.org/] Accessed 3/6/2019.
Publication types
MeSH terms
Grants and funding
LinkOut - more resources
Full Text Sources
Medical

