Cardiovascular End Points and Mortality Are Not Closer Associated With Central Than Peripheral Pulsatile Blood Pressure Components
- PMID: 32639894
- PMCID: PMC7340226
- DOI: 10.1161/HYPERTENSIONAHA.120.14787
Cardiovascular End Points and Mortality Are Not Closer Associated With Central Than Peripheral Pulsatile Blood Pressure Components
Abstract
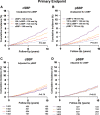
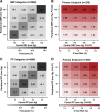
Pulsatile blood pressure (BP) confers cardiovascular risk. Whether associations of cardiovascular end points are tighter for central systolic BP (cSBP) than peripheral systolic BP (pSBP) or central pulse pressure (cPP) than peripheral pulse pressure (pPP) is uncertain. Among 5608 participants (54.1% women; mean age, 54.2 years) enrolled in nine studies, median follow-up was 4.1 years. cSBP and cPP, estimated tonometrically from the radial waveform, averaged 123.7 and 42.5 mm Hg, and pSBP and pPP 134.1 and 53.9 mm Hg. The primary composite cardiovascular end point occurred in 255 participants (4.5%). Across fourths of the cPP distribution, rates increased exponentially (4.1, 5.0, 7.3, and 22.0 per 1000 person-years) with comparable estimates for cSBP, pSBP, and pPP. The multivariable-adjusted hazard ratios, expressing the risk per 1-SD increment in BP, were 1.50 (95% CI, 1.33-1.70) for cSBP, 1.36 (95% CI, 1.19-1.54) for cPP, 1.49 (95% CI, 1.33-1.67) for pSBP, and 1.34 (95% CI, 1.19-1.51) for pPP (P<0.001). Further adjustment of cSBP and cPP, respectively, for pSBP and pPP, and vice versa, removed the significance of all hazard ratios. Adding cSBP, cPP, pSBP, pPP to a base model including covariables increased the model fit (P<0.001) with generalized R2 increments ranging from 0.37% to 0.74% but adding a second BP to a model including already one did not. Analyses of the secondary end points, including total mortality (204 deaths), coronary end points (109) and strokes (89), and various sensitivity analyses produced consistent results. In conclusion, associations of the primary and secondary end points with SBP and pulse pressure were not stronger if BP was measured centrally compared with peripherally.
Keywords: blood pressure; morbidity; mortality; population; risk.
Figures


Similar articles
-
Association of cardiovascular events with central systolic blood pressure: A systemic review and meta-analysis.J Clin Hypertens (Greenwich). 2024 Jul;26(7):747-756. doi: 10.1111/jch.14853. Epub 2024 Jun 17. J Clin Hypertens (Greenwich). 2024. PMID: 38884940 Free PMC article.
-
Risk Stratification by Cross-Classification of Central and Brachial Systolic Blood Pressure.Hypertension. 2022 May;79(5):1101-1111. doi: 10.1161/HYPERTENSIONAHA.121.18773. Epub 2022 Mar 4. Hypertension. 2022. PMID: 35240865 Free PMC article.
-
Relationship between fiducial points on the peripheral and central blood pressure waveforms: rate of rise of the central waveform is a determinant of peripheral systolic blood pressure.Am J Physiol Heart Circ Physiol. 2021 Apr 1;320(4):H1601-H1608. doi: 10.1152/ajpheart.00818.2020. Epub 2021 Feb 19. Am J Physiol Heart Circ Physiol. 2021. PMID: 33606582 Free PMC article.
-
Effects of β-Blockers With and Without Vasodilating Properties on Central Blood Pressure: Systematic Review and Meta-Analysis of Randomized Trials in Hypertension.Hypertension. 2016 Feb;67(2):316-24. doi: 10.1161/HYPERTENSIONAHA.115.06467. Epub 2015 Nov 30. Hypertension. 2016. PMID: 26628678 Review.
-
Prognostic impact from clinic, daytime, and night-time systolic blood pressure in nine cohorts of 13,844 patients with hypertension.J Hypertens. 2014 Dec;32(12):2332-40; discussion 2340. doi: 10.1097/HJH.0000000000000355. J Hypertens. 2014. PMID: 25333682 Review.
Cited by
-
Twenty-Four-Hour Central (Aortic) Systolic Blood Pressure: Reference Values and Dipping Patterns in Untreated Individuals.Hypertension. 2022 Jan;79(1):251-260. doi: 10.1161/HYPERTENSIONAHA.121.17765. Epub 2021 Nov 15. Hypertension. 2022. PMID: 34775789 Free PMC article.
-
The International Database of Central Arterial Properties for Risk Stratification: Research Objectives and Baseline Characteristics of Participants.Am J Hypertens. 2022 Jan 5;35(1):54-64. doi: 10.1093/ajh/hpab139. Am J Hypertens. 2022. PMID: 34505630 Free PMC article.
-
The acute adaptation of skin microcirculatory perfusion in vivo does not involve a local response but rather a centrally mediated adaptive reflex.Front Physiol. 2023 May 4;14:1177583. doi: 10.3389/fphys.2023.1177583. eCollection 2023. Front Physiol. 2023. PMID: 37215174 Free PMC article.
-
The Relationship of Vascular Aging to Reduced Cognitive Function: Pulsatile and Steady State Arterial Hemodynamics.Pulse (Basel). 2022 Nov 18;10(1-4):19-25. doi: 10.1159/000528147. eCollection 2022 Dec. Pulse (Basel). 2022. PMID: 36704265 Free PMC article. Review.
-
Patient preferences for ambulatory blood pressure monitoring devices: Wrist-type or arm-type?PLoS One. 2021 Aug 9;16(8):e0255871. doi: 10.1371/journal.pone.0255871. eCollection 2021. PLoS One. 2021. PMID: 34370782 Free PMC article.
References
-
- Murray CJ, Ezzati M, Flaxman AD, Lim S, Lozano R, Michaud C, Naghavi M, Salomon JA, Shibuya K, Vos T, et al. GBD 2010: design, definitions, and metrics. Lancet. 2012;380:2063–2066. doi: 10.1016/S0140-6736(12)61899-6. - PubMed
-
- O’Rourke MF, Safar ME. Relationship between aortic stiffening and microvascular disease in brain and kidney: cause and logic of therapy. Hypertension. 2005;46:200–204. doi: 10.1161/01.HYP.0000168052.00426.65. - PubMed
-
- Staessen JA, Gasowski J, Wang JG, Thijs L, Den Hond E, Boissel JP, Coope J, Ekbom T, Gueyffier F, Liu L, et al. Risks of untreated and treated isolated systolic hypertension in the elderly: meta-analysis of outcome trials. Lancet. 2000;355:865–872. doi: 10.1016/s0140-6736(99)07330-4. - PubMed
-
- Mitchell GF, Wang N, Palmisano JN, Larson MG, Hamburg NM, Vita JA, Levy D, Benjamin EJ, Vasan RS. Hemodynamic correlates of blood pressure across the adult age spectrum: noninvasive evaluation in the Framingham Heart Study. Circulation. 2010;122:1379–1386. doi: 10.1161/CIRCULATIONAHA.109.914507. - PMC - PubMed
-
- Kaess BM, Rong J, Larson MG, Hamburg NM, Vita JA, Cheng S, Aragam J, Levy D, Benjamin EJ, Vasan RS, et al. Relations of central hemodynamics and aortic stiffness with left ventricular structure and function: the framingham heart study. J Am Heart Assoc. 2016;5:e002693. doi: 10.1161/JAHA.115.002693. - PMC - PubMed
Publication types
MeSH terms
LinkOut - more resources
Full Text Sources
Medical
Miscellaneous

