. 2020 Jul 15;11(1):3547.
doi: 10.1038/s41467-020-17402-2.

Lactate released by inflammatory bone marrow neutrophils induces their mobilization via endothelial GPR81 signaling

Affiliations

Lactate released by inflammatory bone marrow neutrophils induces their mobilization via endothelial GPR81 signaling

Eman Khatib-Massalha et al. Nat Commun. .

Abstract

Neutrophils provide first line of host defense against bacterial infections utilizing glycolysis for their effector functions. How glycolysis and its major byproduct lactate are triggered in bone marrow (BM) neutrophils and their contribution to neutrophil mobilization in acute inflammation is not clear. Here we report that bacterial lipopolysaccharides (LPS) or Salmonella Typhimurium triggers lactate release by increasing glycolysis, NADPH-oxidase-mediated reactive oxygen species and HIF-1α levels in BM neutrophils. Increased release of BM lactate preferentially promotes neutrophil mobilization by reducing endothelial VE-Cadherin expression, increasing BM vascular permeability via endothelial lactate-receptor GPR81 signaling. GPR81-/- mice mobilize reduced levels of neutrophils in response to LPS, unless rescued by VE-Cadherin disrupting antibodies. Lactate administration also induces release of the BM neutrophil mobilizers G-CSF, CXCL1 and CXCL2, indicating that this metabolite drives neutrophil mobilization via multiple pathways. Our study reveals a metabolic crosstalk between lactate-producing neutrophils and BM endothelium, which controls neutrophil mobilization under bacterial infection.


Conflict of interest statement

The authors declare no competing interests.

Figures
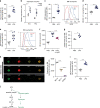
Fig. 1
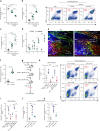
Fig. 1. LPS increases glycolysis as well as lactate production by BM neutrophils.
a Flow cytometry quantitative analysis of 2-NBDG-glucose uptake by BM neutrophils (CD11bhighLy6Ghigh cells; n = 6) 4 h following i.p. administration of LPS in vivo in wild-type (WT) mice. b Gene expression of glycolytic enzymes in sorted BM neutrophils from WT mice following LPS treatment (n = 3, PBS; n = 5, LPS). On each box, the bottom, middle, and the top edges indicate the 25th, 50th, and 75th percentiles, respectively. The whiskers extend to the most extreme data points. c Quantitative analysis and representative histogram plot showing mean fluorescent intensity (MFI) of ROS production in BM neutrophils following LPS administration (n = 9). d Percentage of HIF-1α+ neutrophils in the BM following LPS administration (n = 11). e Quantitative analysis and representative histogram plot of LDHA expression in BM neutrophils following LPS treatment (n = 7). ***p(0.0003). f BM lactate levels in WT mice treated with PBS, LPS, or LPS followed by α-Ly6G Ab (n = 7). g Lactate levels released from isolated BM neutrophils treated ex vivo with PBS or LPS (120 ng/ml; n = 4 mice).**p(0.0063). h MCT4, MCT1, and GPR81 (yellow) distribution on BM CD11b+ (green)/Ly6G+ (red) neutrophils visualized and quantified by ImageStream analysis. Images are from one representative experiment out of three. Scale bar indicates 7 μm. i Quantitative analysis of MCT4 expression on BM neutrophils 4 h following LPS administration (n = 7). j A scheme of the proposed mode of action of LPS in lactate production by BM neutrophils. Data are represented as mean ± SEM from 3 to 4 independent experiments. *p < 0.05; **p < 0.01; ***p < 0.001; ****p < 0.0001, Student’s two-tailed unpaired t test (a, ce, g, i), one-way ANOVA with Tukey’s post hoc test (f, h) or two-way ANOVA with Tukey’s post hoc test (b). See also Supplementary Fig. 1.
Fig. 2
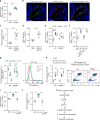
Fig. 2. Lactate induces rapid BM neutrophil mobilization and recruitment.
a BM neutrophil frequency (numbers per 106 acquired cells by flow cytometry) 4 h following i.p. lactate treatment in vivo (n = 6, PBS or 50.5 mg lactate; n = 5, 30 mg lactate).***p (PBS vs. 30 mg lactate) = 0.004. b, c Quantitative analysis and representative flow cytometry density plots for b PB neutrophils and c liver neutrophils frequency (n = 8, PBS or 50.5 mg lactate; n = 6, 30 mg lactate) following lactate injection.***p(PBS vs. 30 mg lactate in the PB) = 0.0008; **p(PBS vs. 30 mg lactate in the liver) = 0.0023; ***p(30 mg lactate vs. 50 mg lactate in the liver) = 0.0003. d Neutrophil frequency in PB at different time points following 50.5 mg lactate treatment (n = 5). e Representative TPLSM 3D images 4 h post PBS (left panel) or lactate (right panel) treatment, in calvarial bone of chimeric mice reconstituted with Ly6G tdTomato neutrophils (red). Sca-1 eGFP marked the endothelial cells (green) and second harmonic generation marked the bone (SHG; blue). White dashed lines indicate superior sagittal sinus (calvaria central sinus), arrows indicate BM, circulating or mobilized neutrophils. Representative images out of three independent experiments are shown. Scale bar, 50 μm. f Quantitative analysis for PB ROShigh neutrophils frequency following lactate administration (n = 6). g A schematic illustration of the protocol for LPS with LDHA or MCT4 inhibitors administration. h Frequency of PB neutrophils following LDHA inhibitors (n = 4, PBS + vehicle; n = 3, LPS + vehicle; n = 4, LPS with FX11; n = 5, two injections of PBS or LPS + PBS; n = 4, LPS with sodium oxamate). i Frequency of PB ROShigh neutrophils following LDHA inhibitors (n = 3, PBS + vehicle or LPS + vehicle; n = 5, LPS with FX11; or two injections of PBS; n = 4, LPS + PBS or LPS with sodium oxamate). j, k Frequency of  j PB neutrophils or k PB ROShigh neutrophils following MCT4 inhibitor (n = 4). j **p(PBS + vehicle vs. LPS + vehicle) = 0.0032; *p(LPS + vehicle vs. LPS + CHC) = 0.0163; k ***p(PBS + vehicle vs. LPS + vehicle) = 0.0006; **p(LPS + vehicle vs. LPS + CHC) = 0.0073. Data are represented as mean ± SEM from 3 to 5 independent experiments. *p < 0.05; **p < 0.01; ***p < 0.001; ****p < 0.0001, one-way ANOVA with Tukey’s post hoc test (ac, hk), two-way ANOVA with Bonferroni post hoc test (d) or Student’s two-tailed unpaired t test (f). See also Supplementary Fig. 2.
Fig. 3
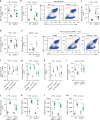
Fig. 3. Lactate production by neutrophils requires NOX/ROS signaling.
a Percentage of BM HIF-1α+ neutrophils in WT (n = 9) and gp91phox−/− (n = 7) mice treated with either PBS or LPS. **p(WT + LPS vs. gp91phox−/−+LPS) = 0.0012. b Quantitative analysis and representative histogram plot showing LDHA expression in BM neutrophils from WT (n = 5) and gp91phox−/− (n = 4) mice. **p(WT + PBS vs. WT + LPS) = 0.0054; *p(WT + LPS vs. gp91phox−/−+LPS) = 0.0131. c Quantitative analysis of MCT4 expression on BM neutrophils from WT (n = 7) and gp91phox−/− (n = 7) mice treated with either PBS or LPS. *p(gp91phox−/−+PBS vs. gp91phox−/−+LPS) = 0.0424. d BM lactate levels in WT (n = 4, PBS; n = 5, LPS) and gp91phox−/− (n = 5, PBS; n = 6, LPS) mice treated with LPS. e BM lactate levels released from WT or gp91phox−/− isolated neutrophils treated ex vivo with PBS or LPS (120 ng/ml; n = 4, WT; n = 3, gp91phox−/−). f, g Frequency of PB neutrophils from WT and gp91phox−/− (f, n = 6; **p(WT + PBS vs. WT + LPS) = 0.0058) and ROShigh neutrophils (g, n = 7, WT + PBS; n = 6, WT + LPS; n = 6, gp91phox−/− mice) following LPS injection. h Quantitative analysis and representative histogram plot of PB ROShigh neutrophils of gp91phox−/− mice treated with PBS, LPS, or LPS together with 50.5 mg lactate (n = 8, PBS or LPS; n = 6, LPS + lactate).**p(LPS vs. LPS + lactate) = 0.0018. Data are represented as mean ± SEM from 3 to 4 independent experiments. *p < 0.05; **p < 0.01; ***p < 0.001; ****p < 0.0001, one-way ANOVA with Tukey’s post hoc test (h) or two-way ANOVA with Tukey’s post hoc test (ag). See also Supplementary Fig. 4.
Fig. 4
Fig. 4. HIF-1α mediates lactate release and inflammatory neutrophil mobilization.
a Gene expression of glycolytic enzymes in sorted BM neutrophils following LPS treatment (WT; n = 3, PBS; n = 5, LPS; HIF-1α−/−, n = 3). On each box, the bottom, middle and the top edges indicate the 25th, 50th, and 75th percentiles, respectively. The whiskers extend to the most extreme data points. b Quantitative analysis and representative flow cytometry histogram plot of LDHA expression in BM neutrophils in WT (n = 6, PBS; n = 7, LPS) vs. HIF-1α−/− (n = 6, PBS; n = 9, LPS) mice. c Quantitative analysis of MCT4 expression on BM neutrophils following either PBS or LPS treatment in WT (n = 6) vs. HIF-1α−/− (n = 7, PBS; n = 6, LPS) mice.***p(WT + PBS vs. WT + LPS) = 0.0001; **p(WT + LPS vs. HIF-1α−/−+LPS) = 0.0053. d BM lactate levels in WT (n = 5) vs. HIF-1α−/− (n = 6) mice. **p(WT + PBS vs. WT + LPS) = 0.0023; **p(WT + LPS vs. HIF-1α−/−+LPS) = 0.0020. e BM Lactate levels released from WT or HIF-1α−/− isolated neutrophils treated in vitro with PBS or LPS (120 ng/ml; n = 4 each group) **p(WT + PBS vs. WT + LPS) = 0.0027. f PB neutrophils frequency in WT (n = 7) and HIF-1α−/− (n = 7, PBS; n = 8, LPS) mice. g Liver neutrophil frequency in WT (n = 8) and HIF-1α−/− (n = 8) mice following LPS treatment. h PB neutrophil frequency in WT (n = 5, PBS; n = 6, lactate) and HIF-1α−/− (n = 5) mice following 50.5 mg lactate treatment. i Liver neutrophil frequency in WT vs. HIF-1α−/− (n = 4, PBS; n = 3, lactate) following lactate administration. Data are represented as mean ± SEM from 3 to 4 independent experiments. *p < 0.05; **p < 0.01; ***p < 0.001; ****p < 0.0001, two-way ANOVA with Bonferroni post hoc test (a) or two-way ANOVA with Tukey’s post hoc test (bi). See also Supplementary Fig. 5.
Fig. 5
Fig. 5. Lactate downregulates VE–cadherin and increases vascular permeability.
a Levels of BM Evans Blue Dye (EBD) absorbance per femur at 620 nm in WT mice treated with PBS or lactate (n = 5). b Representative fluorescence images of Endomucin (green), GPR81 (red; RFP), and nuclei (blue; DAPI) in the femoral diaphysis of GRP81-RFP reporter mice; yellow indicates Endomucin+ GPR81+ sinusoidal BM endothelial cells. Representative images out of four independent experiments are shown. Scale bar indicates 20 μm. c PB neutrophils frequency following 4 h post administration of GPR81 agonist in WT mice (n = 7, PBS; n = 6, GPR81 agonist). ***p(0.0002). df Levels of BM EBD absorbance following GPR81 agonist treatment to WT mice (d, n = 6, PBS; n = 4, GPR81 agonist; ***p(0.0009)), after lactate or LPS injection to WT vs. GPR81−/− mice (e, n = 5, WT + PBS or lactate; n = 3, WT + LPS; n = 3, GPR81−/− + PBS; n = 4, GPR81−/− + lactate; n = 3, GPR81−/− + LPS) and following neutrophil depletion and exposure to LPS and lactate in WT mice (f, n = 5, PBS; n = 3, LPS; n = 5, α-Ly6G Abs + LPS; n = 3, α-Ly6G Abs + LPS + lactate). g Quantitative analysis and representative flow cytometry histogram plot of surface VE–cadherin expression on sBMEC 30 min post injection of lactate or LPS to WT vs. GPR81−/− mice (WT; n = 5, PBS or LPS; n = 6, lactate; GPR81−/−; n = 6, PBS; n = 5, lactate; n = 4, LPS). h Quantitative analysis and representative flow cytometry density plots for PB neutrophils following administration of blocking anti-VE–cadherin antibodies to WT vs. GPR81−/− mice (n = 4 per group). i, j Levels of BM EBD absorbance and neutrophil frequency in PB following treatment with lactate alone or with Epac1 agonist (i, n = 4 per group; j, n = 5 per group). i **p(PBS vs. lactate) = 0.0018; ***p(lactate vs. lactate+Epac1 agonist) = 0.0009; j **p(PBS vs. lactate) = 0.0013; ***p(lactate vs. lactate+Epac1 agonist) = 0.0008. k A scheme depicting lactate mode of action controlling BM vascular permeability via GPR81 signaling. Data are represented as mean ± SEM from 4 to 5 independent experiments. **p < 0.01; ***p < 0.001; ****p < 0.0001, Student’s two-tailed unpaired t test (a, c, d), one-way ANOVA with Tukey’s post hoc test (f, i, j) or two-way ANOVA with Tukey’s post hoc test (e, g, h). See also Supplementary Fig. 6.
Fig. 6
Fig. 6. GPR81/lactate signaling mediates neutrophil mobilization.
a, b Frequency of neutrophils in the BM (a, n = 9) and quantitative analysis and representative flow cytometry density plots for PB neutrophils (b, n = 8) following lactate treatment in WT vs. GPR81−/− mice. **p(GPR81−/− + PBS vs. GPR81−/− + lactate) =0.0017. c Frequency of BM neutrophils in WT (n = 9, PBS; n = 8, LPS) vs. GPR81−/− (n = 9, PBS; n = 8, LPS) mice following LPS treatment. d Frequency of PB neutrophils following LPS administration (n = 7). e Quantitative analysis and representative flow cytometry density plots for PB neutrophils following blocking VE–cadherin antibodies in GPR81−/− mice (n = 4). *p(LPS vs. αVE–Cad + LPS) = 0.0402. f Levels of BM EBD absorbance following lactate treatment in chimeric mice (n = 5, WT to WT + PBS; n = 4, WT to WT + lactate; n = 4, GPR81−/− to WT; n = 4, WT to GPR81−/−). g, h Neutrophil frequency in the PB (g, n = 4, WT to WT; n = 3, GPR81−/− to WT; n = 5, WT to GPR81−/−), and in the liver of chimeric mice (h, n = 4, WT to WT; n = 3, GPR81−/− to WT; n = 5, WT to GPR81−/−) following lactate administration. i, j Frequency of neutrophils in the BM (i; n = 5, PBS; n = 6, lactate) and blood (j, n = 6) following lactate treatment in GPR81f/f/Cdh5cre neg vs. GPR81f/f/Cdh5cre pos mice. k, l Plasma protein levels of CXCL1 in k WT vs. GPR81−/− mice (WT; n = 9, PBS; n = 8, lactate; GPR81−/−; n = 8) or l GPR81f/f/Cdh5cre neg vs. GPR81f/f/Cdh5cre pos mice (n = 6, PBS; n = 7, lactate; per mice group) following lactate treatment. m Plasma protein levels of G-CSF in WT vs. GPR81−/− mice (n = 6, WT + PBS, WT + lactate and GPR81−/− + lactate; n = 5 GPR81−/− + PBS) following lactate treatment. Data are represented as mean ± SEM from 3 to 5 independent experiments. *p < 0.05; **p < 0.01; ***p < 0.001; ****p < 0.0001, two-way ANOVA with Tukey’s post hoc test (ad, fm) or one-way ANOVA with Tukey’s post hoc test (e). See also Supplementary Fig. 7.
Fig. 7
Fig. 7. Salmonella increases lactate production by inflammatory BM neutrophils.
a, b Lactate levels in (a) BM or (b) blood from WT mice treated with PBS or Salmonella (n = 5). a ***p(0.0004); b **p(0.0081). c Quantitative analysis of ROS production in BM neutrophils from WT (n = 7) vs. gp91phox−/− (n = 6) mice infected with Salmonella. d Percentage of BM HIF-1α+ neutrophils in WT (n = 9) vs. gp91phox−/− (n = 9). e Quantitative analysis and representative flow cytometry histogram plot of LDHA expression in BM neutrophils from WT (n = 7, PBS; n = 6, Salmonella; ***p(0.0001)) vs. gp91phox−/− (n = 6, PBS; n = 5, Salmonella) mice. f Quantitative analysis of MCT4 expression on BM neutrophils from WT (n = 6; ***p(0.0008)) and gp91phox−/− (n = 5) mice. g Quantitative analysis and representative flow cytometry histogram plot of ROS production in PB neutrophils from WT (n = 5; **p(0.0030)) vs. gp91phox−/− (n = 7, PBS; n = 6, Salmonella) mice. h Frequency of PB neutrophils from WT (n = 7, PBS; n = 6, Salmonella) vs. gp91phox−/− (n = 7) and GPR81−/− (n = 8) mice. i Frequency of liver neutrophils from WT (n = 7, PBS; n = 6, Salmonella) vs. gp91phox−/− (n = 7) and GPR81−/− (n = 8) mice. Data are represented as mean ± SEM from three independent experiments. *p < 0.05; **p < 0.01; ***p < 0.001, ****p < 0.0001, Student’s two-tailed unpaired t test (a, b), two-way ANOVA with Tukey’s post hoc test (ci).
Fig. 8
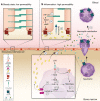
Fig. 8. Mechanisms of lactate-induced neutrophil mobilization from the BM.
Our model suggests that enhanced lactate-produced by BM neutrophils during bacterial infection induces neutrophil mobilization by modulating metabolic signaling in BM endothelial cells. LPS binds TLR4 expressed on neutrophils that directly activates NADPH oxidase (NOX) and enhances glucose uptake via a glucose transporter 1a. Glucose in turn, is converted to pyruvate by the glycolysis pathway 1b. NOX activity leads to ROS production (2) which elevates HIF-1α expression. HIF-1α in turn, induces downstream expression of LDHA that converts pyruvate to lactate 3a. HIF-1α also up-regulates the lactate transporter MCT4 3b to allow lactate release (4). Under steady-state conditions, surface VE–cadherin on endothelial cells (ECs) is highly expressed, which maintains the endothelial barrier integrity with low permeability (a). During inflammation (b), lactate released from BM neutrophils binds to GPR81 on sinusoidal BM endothelial cells 5a, activates Gi protein and thereby reduces cAMP/Epac1 activity 5b. Consequently, lactate via GPR81 signaling decreases surface VE–cadherin expression (5c), leading to higher BM vascular permeability (6). In addition, lactate elevates CXCL1 and G-CSF levels (produced by different cells including ECs,) also in a GPR81-independent manner 7a with more moderate increases in CXCL2 levels in WT mice (most probably produced by BM neutrophils). Lactate-induced elevation of CXCL1, CXCL2, and G-CSF downregulates surface CXCR2 expression on PB neutrophils 7b facilitating neutrophil mobilization (8). Taken together, LPS-induced lactate promotes rapid neutrophil mobilization from the BM to the blood (8) preferentially via BM GPR81/VE–cadherin-dependent (5–6) and also by GPR81-independent (7) pathways.

Similar articles

Cited by

References

    1. Peiseler M, Kubes P. More friend than foe: the emerging role of neutrophils in tissue repair. J. Clin. Investig. 2019;129:2629–2639. - PMC - PubMed
    1. Semerad CL, Liu F, Gregory AD, Stumpf K, Link DC. G-CSF is an essential regulator of neutrophil trafficking from the bone marrow to the blood. Immunity. 2002;17:413–423. - PubMed
    1. Casanova-Acebes M, et al. Rhythmic modulation of the hematopoietic niche through neutrophil clearance. Cell. 2013;153:1025–1035. - PMC - PubMed
    1. Amulic B, Cazalet C, Hayes GL, Metzler KD, Zychlinsky A. Neutrophil function: from mechanisms to disease. Annu. Rev. Immunol. 2012;30:459–489. - PubMed
    1. Kolaczkowska E, Kubes P. Neutrophil recruitment and function in health and inflammation. Nat. Rev. Immunol. 2013;13:159–175. - PubMed

Publication types

MeSH terms

Grants and funding

  NODES
admin 12
Project 1
twitter 2