. 2020 Oct 2;295(40):13753-13768.
doi: 10.1074/jbc.RA120.014381. Epub 2020 Jul 29.

Hepatocyte expression of the micropeptide adropin regulates the liver fasting response and is enhanced by caloric restriction

Affiliations

Hepatocyte expression of the micropeptide adropin regulates the liver fasting response and is enhanced by caloric restriction

Subhashis Banerjee et al. J Biol Chem. .

Abstract

The micropeptide adropin encoded by the clock-controlled energy homeostasis-associated gene is implicated in the regulation of glucose metabolism. However, its links to rhythms of nutrient intake, energy balance, and metabolic control remain poorly defined. Using surveys of Gene Expression Omnibus data sets, we confirm that fasting suppresses liver adropin expression in lean C57BL/6J (B6) mice. However, circadian rhythm data are inconsistent. In lean mice, caloric restriction (CR) induces bouts of compulsive binge feeding separated by prolonged fasting intervals, increasing NAD-dependent deacetylase sirtuin-1 signaling important for glucose and lipid metabolism regulation. CR up-regulates adropin expression and induces rhythms correlating with cellular stress-response pathways. Furthermore, adropin expression correlates positively with phosphoenolpyruvate carboxokinase-1 (Pck1) expression, suggesting a link with gluconeogenesis. Our previous data suggest that adropin suppresses gluconeogenesis in hepatocytes. Liver-specific adropin knockout (LAdrKO) mice exhibit increased glucose excursions following pyruvate injections, indicating increased gluconeogenesis. Gluconeogenesis is also increased in primary cultured hepatocytes derived from LAdrKO mice. Analysis of circulating insulin levels and liver expression of fasting-responsive cAMP-dependent protein kinase A (PKA) signaling pathways also suggests enhanced responses in LAdrKO mice during a glucagon tolerance test (250 µg/kg intraperitoneally). Fasting-associated changes in PKA signaling are attenuated in transgenic mice constitutively expressing adropin and in fasting mice treated acutely with adropin peptide. In summary, hepatic adropin expression is regulated by nutrient- and clock-dependent extrahepatic signals. CR induces pronounced postprandial peaks in hepatic adropin expression. Rhythms of hepatic adropin expression appear to link energy balance and cellular stress to the intracellular signal transduction pathways that drive the liver fasting response.

Keywords: circadian rhythm; diet; glucagon; glucose metabolism; hepatocyte; insulin; peptide hormone; signal transduction; stress response.


Conflict of interest statement

Conflict of interest—The authors declare that they have no conflicts of interest with the contents of this article.

Figures

Figure 1.
Figure 1.
A and B, liver Enho expression in B6 mice allowed unrestricted access to ND (A) (n = 56) or subject to CR (B) for 25 weeks (n = 47). C, heatmap of genes showing positive or negative correlations with Enho expression in the liver. The data shown in A–C are from young (Y, 19–29 weeks of age) or older (O, 55–69 weeks of age) mice subjected to ND or CR conditions. Liver samples were collected at the ZT indicated on the x axis (n = 3–6/group). Enho expression correlates positively with phosphoenolpyruvate carboxykinase (Pck1), which is rate-limiting for gluconeogenesis (D) but is incompatible with expression of genes involved de novo lipogenesis, such as fatty acid synthase (Fasn) (E). Note that the units of expression in D and E are z scores used for the heatmaps shown in C, whereas in A and B, Enho expression is shown as probe intensity. F, Enho expression relative to vehicle control in B6 mice 24 h after treatment with low, medium, or high doses of acetaminophen (APAP; at 169, 225, or 300 mg/kg), isoniazid (INZ; at 22, 44, or 88 g/kg), or paraquat (PQ; at 12.5, 25, or 50 mg/kg) (n = 5/group). Data in A–F were drawn from GSE93903, and data in G are from GSE51969. Correlation coefficients are shown for all data and for ND or CR separately. a, p < 0.05 versus ZT12, ZT16; b, p ≤ 0.05 versus ZT12, ZT16. In C, the heatmap was generated using z scores. In D and E, the values shown are z scores. *, p < 0.05 versus vehicle; **, p < 0.01 versus vehicle.
Figure 2.
Figure 2.
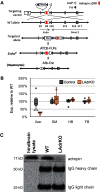
A, _targeting strategy for using Cre/loxP to suppress liver Enho expression. A pair of loxP sites were inserted 5′ and 3′ of the adropin sORF in exon 2. A Frt-flanked neomycin cassette used to select recombinant embryonic stem cells was used for blastocyst injections. This was removed from founder mice using B6;SJL-Tg(ACTFLPe)9205Dym/J mice expressing FLP recombinase in all cell types. ACTFLPe;Enhofl/+ offspring were then crossed with WT B6 mice to remove the transgene. For the current study, Enhofl/+ mice were crossed with Alb-Cre mice; subsequent generations were mated to produce Enhofl/fl mice (controls) and Alb-Cre; Enhofl/fl (LAdrKO) mice. B, comparison of Enho expression in liver, skeletal muscle (SM), hindbrain (HB), and forebrain (FB) in LAdrKO and littermate control mice. Data are expressed related to controls. ***, p < 0.001; *, p < 0.05; n = 8/group. C, immunoprecipitation using a monoclonal adropin antibody detected adropin protein in liver from WT mice, but not from LAdrKO mice.
Figure 3.
Figure 3.
Suppression of hepatic adropin expression associates with dysregulation of glucose metabolism in the absence of changes in body weight or composition. A and B, body weight and composition in adult (9–10-month) male (n = 9 for control, n = 8 for LAdrKO mice) and female (B, n = 8/group) animals. FFM, fat-free mass; FM, fat mass. C–G, pyruvate tolerance test data showing increased glucose excursion in LAdrKO compared with control mice. Data were collected at baseline and after i.p. injection of pyruvate (2 g/kg) in males (C–E) and female (F and G) mice fasted for 6 h. C and F, fasting blood glucose; D, blood glucose and increase in blood glucose above baseline; E and G, area under the curve. H–L, glucose tolerance test (2 g/kg injected i.p. after a 6-h fast) results for males (H–J) and females (K and L). H and K, fasting blood glucose; I, blood glucose and increase in blood glucose above baseline (D); J and K, area under the curve. For males, n = 8 for controls, n = 7 for LAdrKO mice; for females, n = 8/group. D and I, Error bars, S.E.
Figure 4.
Figure 4.
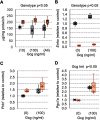
Increased glucose production by primary cultured mouse hepatocytes derived from LAdrKO compared with floxed control mice. A, comparison of glucose production induced by glucagon and pyruvate in control and LAdrKO mice. Two doses were used for the study shown (10 and 100 ng/ml), both with 5 mm pyruvate. *, p < 0.05 versus controls. (All), combined data from 10 and 100 ng/ml doses of glucagon. B and C, gene expression data for primary cultured hepatocytes from LAdrKO and control mice. Data shown are at baseline (0 ng/ml glucagon) or treated with 100 ng/ml glucagon. B, Enho expression is reduced by >90% in primary cultured hepatocytes from LAdrKO mice compared with floxed WT controls. C, Pck1 expression is increased by ∼40% in primary cultured hepatocytes from LAdrKO compared with floxed controls. D, PGC1A expression is increased with glucagon treatment, but this response is not significantly different between primary cultured hepatocytes from LAdrKO and floxed WT controls.
Figure 5.
Figure 5.
Liver fasting-responsive intracellular signaling pathways exhibit enhanced sensitivity in LAdrKO mice during a glucagon tolerance test. Male LAdrKO and WT control mice were food-deprived for 1 h and then administered an i.p. injection of glucagon (250 µg/kg). Blood and tissue samples were collected at the times indicated. A and B, blood glucose levels (A) and percentage change in blood glucose levels relative to baseline within genotype (B). C and D, plasma insulin concentration (C) and percentage change in plasma insulin concentration within genotype (D). E, Western blotting data showing changes in activity of fasting-responsive signaling pathways in liver at baseline (t = 0) and 60 or 180 min after glucagon injections. HSP90 was used as a loading control. Note the two bands recognized by the pCREB antibody; the top band is pCREB-Ser133, and the bottom band is the phosphorylated form of a CREB-related protein (ATF-1). F, scatterplots of quantified data expressed as a ratio; pCREB Ser133 and pATK Ser473 are normalized against total protein, and other proteins measured are normalized using HSP90. Phosphorylation of proteins with PKA consensus sequences following glucagon treatment was more robust in liver lysates from LAdrKO mice (bands used for quantitation are indicated by asterisks in E). Phosphorylation of Thr197 of PKA required for activation remained elevated at the 180-min time point. AKT activity was markedly reduced in LAdrKO, irrespective of glucagon treatment, indicated by low phosphorylation of Ser473. Glucagon treatment increased expression of PGC1A and HNF4A. These effects on PGC1A and HNF4A protein levels were preserved in LAdrKO mice. However, PGC1A protein levels were lower at all time points, whereas HNF4A and SIRT1 expression were initially higher in LAdrKO mice.
Figure 6.
Figure 6.
Expression of transcription factors regulating fasting responses during the glucagon tolerance test in control and LAdrKO mice. The liver samples were from the same animals shown in Fig. 5. Data are expressed as a ratio of WT controls at baseline. Statistical analysis used a two-way analysis of variance (time after injection, genotype) adjusted for age and body weight.
Figure 7.
Figure 7.
Constitutive expression of adropin dysregulates signal transduction pathways involved in the liver fasting response. Adropin transgenic (AdrTG) and WT littermate control (WT) mice were provided ad libitum access to regular chow (Fed) or fasted for 6 h (Fast). A, measurement of liver Enho and Pck1 mRNA expression. There was a trend (p < 0.1) for increased Enho expression in AdrTG; Pck1 expression increased with fasting (p < 0.001), but there was no significant effect of genotype. B and C, analysis of signaling pathways involved in the fasting response showed changes predicted to occur with fasting in WT but not AdrTG mice. B, Western blotting; C, scatterplots showing quantitation of the indicated bands. Fasting increased CREB Ser133 and ATF-1 phosphorylation, phosphorylation of proteins on Ser/Thr residues with Arg at the −3 position (pPKA substrates indicated by the asterisk), and phosphorylation of PKA on Thr197. Fasting also increased levels of HNF4A and FOXO1. The response of these proteins in AdrTG mice to fasting was atypical, whereas PGC1A expression declined with fasting in WT mice it declines in AdrTG; the increase in FOXO1 in WT mice with fasting was also not observed in AdrTG mice. The effects of genotype and fasting on serum concentrations of insulin (D), glucagon (E), and glucose (F) are shown. AdrTG mice exhibit a trend for lower glucose levels irrespective of fed condition. For D and E, n = 7/group. The mice used for this experiment were females.
Figure 8.
Figure 8.
A single injection of adropin34–76 leads to an atypical response of the cAMP-PKA signaling pathways during fasting. A, Western blotting showing expression of the proteins indicated to the right. B, scatterplots of quantitated data. The box and whisker graph below the plot titled pPKA substrates shows data for all bands grouped by genotype and treatment (fed or fasted with or without adropin treatment). This graph shows the clear effect of fasting to increase the phosphorylation of PKA substrates and shows that this effect is attenuated with adropin34–76 treatment. For the experiment, six WT littermates and six LAdrKO mice (males) were fed ad libitum (Fed, n = 2) or fasted for 6 h (n = 4). Mice indicated by the plus sign received a single i.p. injection of 450 nmol/kg adropin34–76 or vehicle (0.9% saline plus 0.1% BSA) 1 h before tissue collection.
Figure 9.
Figure 9.
Model integrating adropin expressed by hepatocytes into the control of glucose metabolism by pancreatic hormones. In this model, adropin expression in the liver is affected by dietary nutrients and cellular stress responses and serves to moderate the response of the liver to regulatory inputs from the pancreas. Euglycemia requires the coordinated release of insulin (INS) and glucagon (GCG) from β-cells and α-cells located in pancreatic islets. INS and GCG released in a pulsatile secretory pattern (88) travel to liver sinusoids via the hepatic portal vein. In the liver, INS and GCG have opposing actions on glucose metabolism in hepatocytes. INS suppresses glucose production, whereas GCG enhances glucose production. The results of the current study and our previous publication (23) suggest that adropin34–76 expressed by hepatocytes suppresses glucose production in part by cross-talk with GCGR. However, a recent study suggests that adropin34–76 suppresses hepatic glucose production independently of GCG (27). The current study indicates that adropin expressed by hepatocytes has a tonic inhibitory effect and is required for normal regulation. Adropin may also act to enhance or complement INS signaling, particularly in situations of metabolic stress that can disrupt INS signaling (23, 27). Suppression of adropin expression with prolonged fasting or metabolic dysregulation in situations of obesity and/or disruption of circadian rhythms may enhance GCG signaling while limiting INS action. However, it should be noted that both GCG and INS action in liver are disrupted in the context of diet-induced obesity (89). Both INS and GCG regulate glycogen and lipid metabolism via pathways that are not shown here; the role of adropin in modulating these actions requires further investigation. It should also be noted that the model incorporates data from the current work and other sources (6, 22, 23, 27).

Similar articles

Cited by

References

    1. Carvunis A. R., Rolland T., Wapinski I., Calderwood M. A., Yildirim M. A., Simonis N., Charloteaux B., Hidalgo C. A., Barbette J., Santhanam B., Brar G. A., Weissman J. S., Regev A., Thierry-Mieg N., Cusick M. E., et al. (2012) Proto-genes and de novo gene birth. Nature 487, 370–374 10.1038/nature11184 - DOI - PMC - PubMed
    1. Saghatelian A., and Couso J. P. (2015) Discovery and characterization of smORF-encoded bioactive polypeptides. Nat. Chem. Biol. 11, 909–916 10.1038/nchembio.1964 - DOI - PMC - PubMed
    1. Khitun A., Ness T. J., and Slavoff S. A. (2019) Small open reading frames and cellular stress responses. Mol. Omics 15, 108–116 10.1039/c8mo00283e - DOI - PMC - PubMed
    1. Makarewich C. A., and Olson E. N. (2017) Mining for micropeptides. Trends Cell Biol. 27, 685–696 10.1016/j.tcb.2017.04.006 - DOI - PMC - PubMed
    1. Kumar K. G., Trevaskis J. L., Lam D. D., Sutton G. M., Koza R. A., Chouljenko V. N., Kousoulas K. G., Rogers P. M., Kesterson R. A., Thearle M., Ferrante A. W. Jr., Mynatt R. L., Burris T. P., Dong J. Z., Halem H. A., et al. (2008) Identification of adropin as a secreted factor linking dietary macronutrient intake with energy homeostasis and lipid metabolism. Cell Metab. 8, 468–481 10.1016/j.cmet.2008.10.011 - DOI - PMC - PubMed

Publication types

MeSH terms

Substances

LinkOut - more resources

  NODES
admin 1
Note 4
twitter 2