. 2020 Jul 17:11:1684.
doi: 10.3389/fmicb.2020.01684. eCollection 2020.

TLR7 Stimulation With Imiquimod Induces Selective Autophagy and Controls Mycobacterium tuberculosis Growth in Mouse Macrophages

Affiliations

TLR7 Stimulation With Imiquimod Induces Selective Autophagy and Controls Mycobacterium tuberculosis Growth in Mouse Macrophages

Hyo-Ji Lee et al. Front Microbiol. .

Abstract

Autophagy is a lysosomal self-digestion pathway that maintains internal homeostasis inside cells and critical process by which the innate immune system eliminates intracellular bacteria. In this study, we showed that stimulation of toll-like receptor 7 (TLR7) with imiquimod (IMQ) triggered autophagic cell death in macrophages by enhancing the generation of reactive oxygen species (ROS) via the p38- or MEK/ERK1/2-mediated signaling pathway in the early phase. IMQ significantly increased mitochondrial ROS and _targeted autophagosomes to the mitochondria. Stimulation of TLR7 with IMQ enhanced the expression of BNIP3, which was localized to mitochondria and interacted with beclin-1, leading to mitophagy. In addition, IMQ substantially induced NO production through the GSK-3β-mediated signaling pathway, which led to autophagy in the late stage. We further examined whether the induction of autophagy by IMQ effectively eliminated intracellular microbes. Macrophages were infected with a virulent Mycobacterium tuberculosis (Mtb) strain, H37Rv, and then treated with IMQ. IMQ suppressed intracellular Mtb growth by inducing autophagy in a dose-dependent manner and increased NO production. Inhibition of autophagy using 3-methyladenine (3-MA) prevented autophagosome formation and control of intracellular Mtb growth in macrophages. These findings revealed a novel mechanism by which IMQ induces selective autophagy to promote intracellular killing machinery against Mtb infection in macrophages.

Keywords: Mycobacterium tuberculosis; autophagosome; imiquimod (IMQ); mitophagy; mycobactericidal activity; toll-like receptor 7 (TLR7).


Figures

FIGURE 1
FIGURE 1
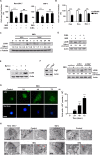
IMQ induces autophagy in macrophages. (A) Raw264.7 or THP-1 cells were treated with IMQ (2 μg/mL) for 48 h in the presence or absence of 3-MA (10 mM for 2 h). (B) Raw264.7 cells were pretreated with necrostatin-1 (Nec-1; 50 μM for 1 h) or z-VAD-FMK (Pan; 10 μM for 2 h) and treated with IMQ. (A,B) Cell survival was assessed by WST-1 assays. (C,D) Western blots were performed with antibodies against LC3, α-tubulin or actin in Raw264.7 cells. (E) Raw264.7 cells were pretreated with bafilomycin A1 and then treated with IMQ. Protein levels of LC3B and actin were detected by a Western blot assay. (F) Raw264.7 cells were transfected with scrambled siRNA (siScr) or siRNA _targeting Atg7 and then treated with IMQ (2 μg/mL) for 48 h. Protein levels of LC3B, actin and Atg7 were detected by a Western blot assay. (G) Raw264.7 cells were incubated with IMQ (2 μg/mL) for the indicated times, and intracellular LC3 (green) was monitored. The nucleus was stained with DAPI (blue). Left panel: representative immunofluorescence images; scale bar 5 μm. Right panel: quantitative analysis of the percentages of cells with LC3+ puncta. (H) Multilayer membranes were observed by TEM. M, mitochondria, autophagic vacuoles; red arrows, black scale bar; 2 μm, white scale bar; 1 μm. (A–G) Data are the means ± s.d. of three technical replicates and are representative of at least three independent experiments. (H) Images are representative of at least three independent experiments. Statistical significance is indicated as ***p < 0.001 and ns, not significant (p > 0.05).
FIGURE 2
FIGURE 2
NO production is induced at a late time point after IMQ treatment in macrophages. (A) Raw264.7 cells were treated with IMQ (2 μg/mL) for the indicated times. NO production was measured in culture supernatants using an NO detection kit. (B) Western blot analysis using antibodies against iNOS and α-tubulin. S.E., short-exposure; L.E., long-exposure. (C,D) Total cell lysates were assessed by Western blot analysis for the detection of (C) phospho-MEK1/2, total MEK1/2, phospho-ERK, total ERK, (D) PI3K, phospho-GSK-3β (Ser9), total GSK-3β, phospho-p70S6K, and total p70S6K. α-Tubulin was utilized as the loading control. (E) Raw264.7 cells were pretreated with U0126, SB216763, or wortmannin for 1 h before treatment with IMQ. Culture supernatants were used for the detection of NO production. (F) NO production was detected in culture supernatants of Raw264.7 cells that were transfected with a specific siRNA for GSK-3β (siGSK-3β). Western blot assays were performed to assess transfection efficiency. All experiments were carried out in three independent experiments. Statistical significance is indicated as *p < 0.05, **p < 0.01, ***p < 0.001, and ns, not significant (p > 0.05).
FIGURE 3
FIGURE 3
IMQ induces autophagy by enhancing NO production via MEK-ERK1/2- and GSK-3β-mediated signaling. Raw264.7 cells were pretreated with U0136 (10 μM for 2 h), SB216763 (10 μM for 2 h), PD98059 (20 μM for 1 h) or wortmannin (2 μM for 1 h) before treatment with IMQ. (A) Western blots were performed with antibodies against LC3 or α-tubulin. (B) Representative immunofluorescence images; scale bar 5 μm. (C) Quantitative analysis of the percentages of cells with LC3+ puncta at 24 h after IMQ treatment. Data are the means ± s.d. of three technical replicates and are representative of at least three independent experiments. Images are representative of at least three independent experiments. Statistical significance is indicated as **p < 0.01, ***p < 0.001 and ns, not significant (p > 0.05).
FIGURE 4
FIGURE 4
ROS are responsible for the early induction of autophagy in IMQ-treated cells. Intracellular ROS levels were determined by the intensity of DCF fluorescence using (A) confocal microscopy or (B) flow cytometry. (A,B) The bar graph represents the percentage of DCF fluorescence intensity. (C,D) Raw264.7 cells were pretreated with DPI and then treated with IMQ. LC3-positive cells were observed under confocal microscopy. The bar graph represents the percentage of cells with LC3+ puncta. (D) Western blots were performed with antibodies against each protein. Data are the means ± s.d. of three technical replicates and are representative of at least three independent experiments. Images are representative of at least three independent experiments. Statistical significance is indicated as *p < 0.05 and ***p < 0.001.
FIGURE 5
FIGURE 5
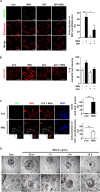
IMQ also induces mitophagy in macrophages. (A) Mitochondrial ROS were detected using MitoTracker Red and DCF-DA staining under confocal microscopy. The bar graph represents the percentage of MitoTracker Red overlapping with DCF fluorescence. (B) Raw264.7 cells were treated with IMQ in the presence or absence of an NADPH oxidase inhibitor, apocynin (Apo). Mitochondrial ROS level was measured by staining with MitoSOX Red. The bar graph represents the percentage of MitoSOX Red fluorescence intensity. (C) The overlapping signal of MitoTracker Red (mito) and LC3 was observed by confocal microscopy. The percentage of autophagy indicated by LC3-positive cells. The percentage of mitophagy indicates the overlapping signal between MitoTracker Red and LC3+ puncta. (D) Mitochondria surrounded by multilayer membranes were detected by TEM. Yellow arrowhead, mitochondria; red arrowhead, autophagosome; M, mitochondrion; Black scale bar, 2 μm; white scale bar, 1 μm. (A–C) Data are the means ± s.d. of three technical replicates and are representative of at least three independent experiments. Images are representative of at least three independent experiments. Statistical significance is indicated as *p < 0.05 and ***p < 0.001.
FIGURE 6
FIGURE 6
BNIP3 is recruited to the mitochondria and associated with beclin-1 in IMQ-treated macrophages. (A) mRNA expression of BNIP3 was detected by RT-PCR in IMQ-treated cells. (B) The overlapping signal between MitoTracker Red (mito) and BNIP3 was observed by confocal microscopy at 30 min and 6 h in IMQ-treated cells. The bar graph represents the percentage of MitoTracker Red overlapping with BNIP3. (C) Raw264.7 cells were treated with IMQ for 30 min and fixed and stained with anti-Tom20, anti-beclin-1 and anti-BNIP3 antibodies. The overlapping signal of these proteins was detected by confocal microscopy. Bar graphs represent the percentage of beclin-1 accumulation in Tom20+ mitochondria and beclin-1 overlapping with BNIP3. (D) Total cell lysates were immunoprecipitated with anti-beclin-1 and analyzed by Western blotting using antibodies against BNIP3, Atg5, beclin-1, LC3B, and actin. Data are the means ± s.d. of three technical replicates and are representative of at least three independent experiments. Images are representative of at least three independent experiments. Statistical significance is indicated as **p < 0.01 and ***p < 0.001.
FIGURE 7
FIGURE 7
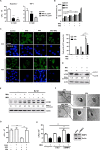
IMQ controls intracellular Mtb growth by inducing autophagy. (A) Raw264.7 or THP-1 cells were infected with H37Rv (at an MOI of 10) for 4 h, washed to remove extracellular bacteria and treated with IMQ (2 μg/mL, 10 μg/mL) for 3 days. Intracellular bacterial growth was measured with CFU assays. Colonies were counted at 21 days after inoculation. (B) Raw264.7 cells were infected with H37Rv (at an MOI of 1) for 4 h and treated with IMQ for the indicated times. NO production was detected in culture supernatants using an NO detection kit. (C) Intracellular LC3 expression was detected with immunofluorescence analysis under confocal microscopy. The bar graph represents the percentage of cells with LC3+ puncta. (D) Western blotting was performed with antibodies against LC3 or α-tubulin. (E) Raw264.7 cells were pretreated with bafilomycin A1 and then infected with H37Rv at an MOI of 1 in the presence or absence of IMQ (2 μg/mL). Protein levels of LC3B and actin were detected by a Western blot assay. (F) Mtb surrounded by multilayer membranes was observed by TEM. Black scale bar; 1 μm, white scale bar; 250 nm. (G) Raw264.7 cells were pretreated with 3-MA and then treated with IMQ after H37Rv infection. Intracellular bacterial growth was measured with CFU assays. Colonies were counted at 21 days after inoculation. (H) Raw264.7 cells were transfected with scrambled siRNA (siScr) or siRNA _targeting BNIP3 and then infected with H37Rv at an MOI of 1 in the presence or absence of IMQ (2 μg/mL) for 48 h. Intracellular bacterial growth was assessed with a CFU assay. Data are the means ± s.d. of three technical replicates and are representative of at least three independent experiments. Images are representative of at least three independent experiments. Statistical significance is indicated as *p < 0.05, **p < 0.01, ***p < 0.001 and ns, not significant (p > 0.05).

Similar articles

Cited by

References

    1. Akinbobuyi B., Wang L., Upchurch K. C., Byrd M. R., Chang C. A., Quintana J. M., et al. (2016). Synthesis and immunostimulatory activity of substituted TLR7 agonists. Bioorg. Med. Chem. Lett. 26 4246–4249. 10.1016/j.bmcl.2016.07.049 - DOI - PubMed
    1. Azad M. B., Chen Y., Gibson S. B. (2009). Regulation of autophagy by reactive oxygen species (ROS): implications for cancer progression and treatment. Antioxid. Redox Signal. 11 777–790. 10.1089/ARS.2008.2270 - DOI - PubMed
    1. Azad M. B., Chen Y., Henson E. S., Cizeau J., McMillan-Ward E., Israels S. J., et al. (2008). Hypoxia induces autophagic cell death in apoptosis-competent cells through a mechanism involving BNIP3. Autophagy 4 195–204. 10.4161/auto.5278 - DOI - PMC - PubMed
    1. Baldanta S., Fernandez-Escobar M., Acin-Perez R., Albert M., Camafeita E., Jorge I., et al. (2017). ISG15 governs mitochondrial function in macrophages following vaccinia virus infection. PLoS Pathog. 13:e1006651. 10.1371/journal.ppat.1006651 - DOI - PMC - PubMed
    1. Bao M., Yi Z., Fu Y. (2017). Activation of TLR7 Inhibition of Mycobacterium Tuberculosis survival by autophagy in RAW 264.7 macrophages. J. Cell Biochem. 118 4222–4229. 10.1002/jcb.26072 - DOI - PubMed
  NODES
INTERN 1
twitter 2