Review
. 2020 Sep 26;396(10255):918-934.
doi: 10.1016/S0140-6736(20)31761-X. Epub 2020 Sep 3.

NCD Countdown 2030: pathways to achieving Sustainable Development Goal _target 3.4

Review

NCD Countdown 2030: pathways to achieving Sustainable Development Goal _target 3.4

NCD Countdown 2030 collaborators. Lancet. .

Erratum in

  • Department of Error.
    [No authors listed] [No authors listed] Lancet. 2020 Nov 28;396(10264):1736. doi: 10.1016/S0140-6736(20)32479-X. Lancet. 2020. PMID: 33248495 Free PMC article. No abstract available.

Abstract

The Sustainable Development Goal (SDG) _target 3.4 is to reduce premature mortality from non-communicable diseases (NCDs) by a third by 2030 relative to 2015 levels, and to promote mental health and wellbeing. We used data on cause-specific mortality to characterise the risk and trends in NCD mortality in each country and evaluate combinations of reductions in NCD causes of death that can achieve SDG _target 3.4. Among NCDs, ischaemic heart disease is responsible for the highest risk of premature death in more than half of all countries for women, and more than three-quarters for men. However, stroke, other cardiovascular diseases, and some cancers are associated with a similar risk, and in many countries, a higher risk of premature death than ischaemic heart disease. Although premature mortality from NCDs is declining in most countries, for most the pace of change is too slow to achieve SDG _target 3.4. To investigate the options available to each country for achieving SDG _target 3.4, we considered different scenarios, each representing a combination of fast (annual rate achieved by the tenth best performing percentile of all countries) and average (median of all countries) declines in risk of premature death from NCDs. Pathways analysis shows that every country has options for achieving SDG _target 3.4. No country could achieve the _target by addressing a single disease. In at least half the countries, achieving the _target requires improvements in the rate of decline in at least five causes for women and in at least seven causes for men to the same rate achieved by the tenth best performing percentile of all countries. Tobacco and alcohol control and effective health-system interventions-including hypertension and diabetes treatment; primary and secondary cardiovascular disease prevention in high-risk individuals; low-dose inhaled corticosteroids and bronchodilators for asthma and chronic obstructive pulmonary disease; treatment of acute cardiovascular diseases, diabetes complications, and exacerbations of asthma and chronic obstructive pulmonary disease; and effective cancer screening and treatment-will reduce NCD causes of death necessary to achieve SDG _target 3.4 in most countries.


Figures

Figure 1
Figure 1
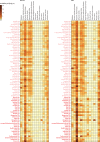
Probability of dying (reported as a percentage) in 2015 between 30 years and 70 years of age from NCD4 causes, by country The colour of text for each country indicates a region (for a list of countries in each region see appendix p 43). The number in parentheses following each country's name indicates the quality of its vital registration system: 1=high, 2=medium, 3=low, and 4=very low., See appendix pp 29–30 for results on all non-communicable diseases plus suicide between birth and 80 years of age. NCD4=four non-communicable diseases including cancers, cardiovascular diseases, chronic respiratory diseases, and diabetes.
Figure 1
Figure 1
Probability of dying (reported as a percentage) in 2015 between 30 years and 70 years of age from NCD4 causes, by country The colour of text for each country indicates a region (for a list of countries in each region see appendix p 43). The number in parentheses following each country's name indicates the quality of its vital registration system: 1=high, 2=medium, 3=low, and 4=very low., See appendix pp 29–30 for results on all non-communicable diseases plus suicide between birth and 80 years of age. NCD4=four non-communicable diseases including cancers, cardiovascular diseases, chronic respiratory diseases, and diabetes.
Figure 2
Figure 2
Distribution (percentiles of countries) of yearly percentage change from 2010 to 2016 in probability of dying between 30 years and 70 years of age from NCD4 causes of death The tenth percentile indicates the rate of change that the top 10% of countries (18) are declining faster than, the 50th percentile is the median rate of change, and the 90th percentile shows the rate of change which 10% (18) of countries are slower than. See appendix pp 36–37 for results on all non-communicable diseases plus suicide between birth and 80 years of age. The green dashed vertical line shows the average rate of decline (2·67% per year; appendix pp 8–9) needed to achieve a third reduction in the probability of death from each cause by 2030 compared with 2015 levels. NCD4=four non-communicable diseases including cancers, cardiovascular diseases, chronic respiratory diseases, and diabetes.
Figure 3
Figure 3
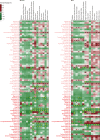
Yearly percentage change from 2010 to 2016 in probability of dying between 30 years and 70 years of age from NCD4 causes of death by country The cells marked with a gold dot show country-disease combinations that were in the fastest 10% of declines. The cells marked with a black dot show country-disease combinations that were in the slowest 10% of declines. See appendix pp 38–39 for results on all non-communicable diseases plus suicide between birth and 80 years of age. NCD4=four non-communicable diseases including cancers, cardiovascular diseases, chronic respiratory diseases, and diabetes.
Figure 3
Figure 3
Yearly percentage change from 2010 to 2016 in probability of dying between 30 years and 70 years of age from NCD4 causes of death by country The cells marked with a gold dot show country-disease combinations that were in the fastest 10% of declines. The cells marked with a black dot show country-disease combinations that were in the slowest 10% of declines. See appendix pp 38–39 for results on all non-communicable diseases plus suicide between birth and 80 years of age. NCD4=four non-communicable diseases including cancers, cardiovascular diseases, chronic respiratory diseases, and diabetes.
Figure 4
Figure 4
Percentage of all possible cause-of-death reduction scenarios that would achieve Sustainable Development Goal _target 3.4 in each country Each scenario represents one combination of fast (or ambitious) and average declines in probability of premature death from the different causes of death.
Figure 5
Figure 5
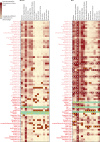
The degree of necessity of a fast decline for different causes of death for achieving SDG _target 3.4 in each country For each cause of death in each country the share of successful scenarios (ie, those that meet SDG _target 3.4) in which that cause of death is allocated the fast versus the average rate of decline is depicted. If a cause of death accounts for only a small share of NCD4 deaths between people aged 30 years and 70 years, then the cause will not require the fast rate in the successful scenarios and the median rate will suffice. Conversely, if a cause of death accounts for a large share of NCD4 deaths in a country, especially one for which the global median decline is slow, then a high percentage of scenarios must include the fast decline to achieve success. The numbers next to each country show the percentage of all possible disease reduction scenarios that would achieve SDG _target 3.4 (values from figure 4). Countries in pale green are those that are already on track to achieve the _target. The cells marked with a gold dot show cause-of-death and country combinations in countries that were in the fastest 10% of declines. The cells marked with a grey-white circle show causes-of-death and country combinations for countries in which a fast decline was necessary for all successful scenarios. SDG=Sustainable Development Goals. NCD4=four non-communicable diseases including cancers, cardiovascular diseases, chronic respiratory diseases, and diabetes.
Figure 5
Figure 5
The degree of necessity of a fast decline for different causes of death for achieving SDG _target 3.4 in each country For each cause of death in each country the share of successful scenarios (ie, those that meet SDG _target 3.4) in which that cause of death is allocated the fast versus the average rate of decline is depicted. If a cause of death accounts for only a small share of NCD4 deaths between people aged 30 years and 70 years, then the cause will not require the fast rate in the successful scenarios and the median rate will suffice. Conversely, if a cause of death accounts for a large share of NCD4 deaths in a country, especially one for which the global median decline is slow, then a high percentage of scenarios must include the fast decline to achieve success. The numbers next to each country show the percentage of all possible disease reduction scenarios that would achieve SDG _target 3.4 (values from figure 4). Countries in pale green are those that are already on track to achieve the _target. The cells marked with a gold dot show cause-of-death and country combinations in countries that were in the fastest 10% of declines. The cells marked with a grey-white circle show causes-of-death and country combinations for countries in which a fast decline was necessary for all successful scenarios. SDG=Sustainable Development Goals. NCD4=four non-communicable diseases including cancers, cardiovascular diseases, chronic respiratory diseases, and diabetes.
Figure 6
Figure 6
Number of countries in which a cause of death must be declining with a fast trend to achieve SDG _target 3.4 The numbers exclude countries that are already on track to achieve SDG _target 3.4 (shown in pale green in Figure 4, Figure 5) but include countries in which the decline is already in the top 10%. SDG=Sustainable Development Goal.
None
None
None
None
None

Similar articles

Cited by

References

    1. WHO Disease burden and mortality estimates: cause-specific mortality, 2000–2016. https://www.who.int/healthinfo/global_burden_disease/estimates/en/
    1. WHO . World Health Organization; Geneva: 2018. World health statistics 2018: monitoring health for the SDGs.
    1. NCD Countdown 2030 collaborators NCD Countdown 2030: worldwide trends in non-communicable disease mortality and progress towards Sustainable Development Goal _target 3.4. Lancet. 2018;392:1072–1088. - PubMed
    1. United Nations Transforming our world: the 2030 agenda for sustainable development. https://sdgs.un.org/sites/default/files/publications/21252030%20Agenda%2...
    1. Ezzati M, Pearson-Stuttard J, Bennett JE, Mathers CD. Acting on non-communicable diseases in low- and middle-income tropical countries. Nature. 2018;559:507–516. - PubMed

Publication types

MeSH terms

  NODES
twitter 2