. 2020 Sep 10;8(1):159.
doi: 10.1186/s40478-020-01031-3.

Activation of Toll-like receptor 5 in microglia modulates their function and triggers neuronal injury

Affiliations

Activation of Toll-like receptor 5 in microglia modulates their function and triggers neuronal injury

Masataka Ifuku et al. Acta Neuropathol Commun. .

Abstract

Microglia are the primary immune-competent cells of the central nervous system (CNS) and sense both pathogen- and host-derived factors through several receptor systems including the Toll-like receptor (TLR) family. Although TLR5 has previously been implicated in different CNS disorders including neurodegenerative diseases, its mode of action in the brain remained largely unexplored. We sought to determine the expression and functional consequences of TLR5 activation in the CNS. Quantitative real-time PCR and immunocytochemical analysis revealed that microglia is the major CNS cell type that constitutively expresses TLR5. Using Tlr5-/- mice and inhibitory TLR5 antibody we found that activation of TLR5 in microglial cells by its agonist flagellin, a principal protein component of bacterial flagella, triggers their release of distinct inflammatory molecules, regulates chemotaxis, and increases their phagocytic activity. Furthermore, while TLR5 activation does not affect tumor growth in an ex vivo GL261 glioma mouse model, it triggers microglial accumulation and neuronal apoptosis in the cerebral cortex in vivo. TLR5-mediated microglial function involves the PI3K/Akt/mammalian _target of rapamycin complex 1 (mTORC1) pathway, as specific inhibitors of this signaling pathway abolish microglial activation. Taken together, our findings establish TLR5 as a modulator of microglial function and indicate its contribution to inflammatory and injurious processes in the CNS.

Keywords: Chemotaxis; Cytokines; Microglia; Neuronal apoptosis; PI3K/Akt/mTORC1 signaling; Phagocytosis; Toll-like receptor 5.


Conflict of interest statement

The authors declare that they have no competing interests.

Figures
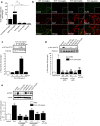
Fig. 1
Fig. 1
TLR5 is constitutively expressed in microglia, and its activation triggers PDK1 and Akt phosphorylation in a PI3K-dependent manner. a Relative TLR5 expression levels were assessed in primary neonatal microglia, primary adult microglia, primary astrocytes, and primary cortical neurons isolated from C57BL/6 mice, as well as Oli-neu cells by quantitative RT-PCR (fold-change compared to neurons). TATA sequence binding protein (TBP) was used as housekeeping control (n = 3). Results are represented as mean ± SD. Data were analyzed by one-way ANOVA followed by Newman-Keuls test. *P < 0.05; **P < 0.01. b Cultured neonatal microglia, astrocytes, and neurons from C57BL/6 (WT) mice, as well as microglia from Tlr5/ mice were stained with antibody directed against TLR5 and co-stained with Iba1, S100β, or NeuN antibody serving as microglial, astrocyte, and neuronal marker, respectively. Scale bar, 10 μm. c Western blot analysis of microglial lysates using antibodies against p-Akt and total Akt after incubation of microglia with 100 ng/ml flagellin (FLA) for 0, 5, 15, 30, or 60 min (n = 3). Representative blots are shown in the upper panel. The graph depicts the average intensity ratio of the bands compared to control (lower panel). Data are expressed as mean ± SEM and were analyzed by one-way ANOVA followed by Dunnett’s post hoc test. **P < 0.01 vs. control. d Western blot analysis of FLA-mediated Akt phosphorylation after treatment of microglia with LY294002 (25 and 50 μM), Wortmannin (0.1 and 1 μM), and anti-mTLR5-IgG (1 μg/ml) (upper panel, n = 3). The graph shows the average intensity ratio of the bands compared to control (lower panel). e Western blot analysis of microglial lysates with antibodies against p-PDK1 and β-actin after incubation of microglia with 100 ng/ml FLA, FLA plus LY294002 (25 and 50 μM), FLA plus Wortmannin (0.1 and 1 μM), and FLA plus anti-mTLR5-IgG (1 μg/ml) (upper panel, n = 3). The graph depicts average intensity ratio of the bands compared to control (lower panel). Data are expressed as mean ± SEM and were analyzed by one-way ANOVA followed by Tukey’s post hoc test. **P < 0.01 vs. control; ##P < 0.01 vs. FLA. d, e DMSO-containing DMEM served as control, while FLA was solved in DMSO-containing DMEM
Fig. 2
Fig. 2
Flagellin induces the release of cytokines and chemokines from microglia through TLR5 signaling. a Multiplex immunoassay was used to detect cytokines/chemokines, as indicated, in supernatants of cultured neonatal microglia from C57BL/6 (WT) and Tlr5/ mice in response to 100 ng/ml flagellin (FLA) after 24 h. Unstimulated cells served as negative control, while LPS (100 ng/ml) was used as positive control (n = 3). b Supernatants of cultured neonatal WT microglia stimulated with 10 ng/ml, 100 ng/ml, 1000 ng/ml FLA, or 100 ng/ml LPS were analyzed for indicated cytokines/chemokines after 24 h by multiplex immunoassay. Unstimulated cells served as control (n = 3). Results are expressed as mean ± SEM. Data were analyzed by Kruskal–Wallis test followed by Dunn’s post hoc test. *P < 0.05; **P < 0.01 vs. control. c Cultured neonatal WT microglia were stimulated with 100 ng/ml FLA and/or 100 ng/ml LPS for 24 h, and supernatants were analyzed for NO using Griess assay (n = 3). Results are expressed as mean ± SEM. Data were analyzed by Kruskal–Wallis test followed by Dunn’s post hoc test. **P < 0.01 vs. control; n.s., not significant. d WT microglia were incubated with 100 ng/ml FLA alone or in combination with LY294002 (50 μM), Wortmannin (1 μM), rapamycin (100 μM), or anti-mTLR5-IgG (1 μg/ml) for 6 h. DMSO-containing DMEM served as control, while FLA was solved in DMSO-containing DMEM. Subsequently, quantitative RT-PCR using primers against TNF-α was performed. TBP served as housekeeping gene (n = 5). Results are expressed as normalized to control and are represented as mean ± SD. Data were analyzed by one-way ANOVA followed by Tukey’s post hoc test. **P < 0.01 vs. control; ##P < 0.01 vs. FLA
Fig. 3
Fig. 3
Flagellin triggers chemotaxis, but not random motility in microglia, through TLR5 and PI3K/PDK1/Akt/mTORC1 signaling. ac Microglial migration in response to flagellin (FLA) was analyzed by agarose spot assay. a Images of FLA- and PBS (control)-treated C57BL/6 microglia. Scale bar, 100 μm. b Various FLA doses, as indicated, were added either to the spot alone (gradient/black, n = 8) or c to both the spot and the culture medium (no gradient/grey, n = 4). PBS was used as negative control. Microglial migration was quantified after 6 h of FLA incubation. Results are expressed as mean ± SEM. Data were analyzed by one-way ANOVA followed by Tukey’s post hoc test. *P < 0.05; **P < 0.01 vs. control; ##P < 0.01. d Microglial migration in response to FLA was analyzed by Boyden chamber assay. Images of C57BL/6 microglia plated in the upper compartment and treated with 100 ng/ml FLA. PBS served as control. Scale bar, 100 μm (upper panel). Microglial migration in response to various FLA doses, as indicated, was quantified after 6 h (lower panel, n = 10). Results are expressed as mean ± SEM. Data were analyzed by one-way ANOVA followed by Dunnett’s post hoc test. **P < 0.01 vs. control. e Quantification of microglia plated in both wells of the Boyden chamber lacking a gradient (n = 10). Results are expressed as mean ± SEM. Data were analyzed by one-way ANOVA followed by Dunnett’s post hoc test. n.s., not significant. f Agarose spot assay testing microglial migration, as described in (a, b) in the presence of various doses of mouse TLR5-neutralizing antibody (anti-mTLR5), as indicated (n = 4). Results are expressed as mean ± SEM. Data were analyzed by one-way ANOVA followed by Dunnett’s post hoc test. **P < 0.01 vs. control; ##P < 0.01. g Agarose spot assay testing microglial migration, as described in (a, b) in the presence of LY294002 (25 and 50 μM) and Wortmannin (0.1 and 1 μM), n = 12. Results are expressed as mean ± SEM. Data were analyzed by one-way ANOVA followed by Tukey’s post hoc test. **P < 0.01 vs. control; ##P < 0.01 vs. FLA. h FLA-induced (100 ng/ml) microglial migration in the Boyden chamber in the presence of LY294002 (25 and 50 μM), Wortmannin (0.1 and 1 μM), rapamycin (10 and 100 μM), or anti-mTLR5-IgG (1 μg/ml), n = 12. Results are expressed as mean ± SEM. Data were analyzed by one-way ANOVA followed by Tukey’s post hoc test. **P < 0.01 vs. control; ##P < 0.01 vs. FLA. (i) FLA-induced (100 ng/ml) microglial migration tested by agarose spot assay in the presence of rapamycin (10 and 100 μM) or Akt inhibitor IV (1 μM), n = 4. Results are expressed as mean ± SEM. Data were analyzed by one-way ANOVA followed by Tukey’s post hoc test. **P < 0.01 vs. control; ##P < 0.01 vs. FLA. gi DMSO-containing DMEM served as control, while FLA was solved in DMSO-containing DMEM
Fig. 4
Fig. 4
Flagellin-induced microglial phagocytosis is mediated by TLR5 and the PI3K/PDK1/Akt/mTOR pathway. a Using FACS-based phagocytosis assay incorporation of Alexa Fluor 405-labelled beads into microglia was quantified. The image shows representative histograms, in which peaks represent the number of microglia that phagocytosed none or one to four beads in the absence (control, black) and presence of flagellin (FLA, 100 ng/ml, gray). b The phagocytic index derived from the data shown in (a) was determined and normalized to control. In addition, FLA-treated microglia in the presence of LY294002 (50 μM), Wortmannin (1 μM), rapamycin (100 μM), or anti-mTLR5-IgG (1 μg/ml) were tested (n = 4). DMSO-containing DMEM served as control, while FLA was solved in DMSO-containing DMEM. Results are expressed as mean ± SEM. Data were analyzed by one-way ANOVA followed by Tukey’s post hoc test. **P < 0.01 vs. control; ##P < 0.01 vs. FLA
Fig. 5
Fig. 5
Flagellin induces neuronal cell death through TLR5 in vitro. a Co-cultures of C57BL/6 (WT) neurons and WT or Tlr5/ microglia were incubated with 100 ng/ml flagellin (FLA) for 72 h. Subsequently, cells were stained with NeuN antibody to mark neurons, and DAPI to label nuclei, and representative images are shown (scale bar, 50 μm; n = 3). b, c NeuN-positive cells in co-cultures treated with different FLA doses, as indicated, for 72 h (b), or with 100 ng/ml FLA for different time periods, as indicated (c), were quantified, and results were expressed as relative neuronal viability by setting the viability of control cells to 100%. 1 μg/ml LPS served as positive control, whereas unstimulated condition served as negative control (n = 3). d Images of TUNEL-positive and DAPI-labeled nuclei in unstimulated (control) and FLA-treated co-cultures containing WT microglia are shown (scale bar, 50 μm; n = 4). e Quantification of TUNEL-positive cells in co-cultures incubated with different FLA doses, as indicated, and with LPS, serving as positive control, relative to control (n = 4). Data are expressed as mean ± SEM. Results were analyzed by Kruskal–Wallis test followed by Dunn’s post hoc test. *P < 0.05; **P < 0.01 vs. control; #P < 0.01 vs. Tlr5/. f, g Purified neurons from C57BL/6 mice were incubated with various FLA doses, as indicated, 1 μg/ml LPS, or 1 mM loxoribine (LOX) for 72 h (f), or were incubated with 100 ng/ml FLA for indicated durations (g, n = 3). Subsequently, cells were stained with NeuN antibody and DAPI. NeuN-positive cells were quantified, and results were expressed as relative neuronal viability by setting the viability of control cells to 100%. Data are expressed as mean ± SEM. Results were analyzed by Kruskal–Wallis test followed by Dunn’s post hoc test. *P < 0.05 vs. control; n.s., not significant
Fig. 6
Fig. 6
Intrathecal flagellin triggers neuronal injury in the cerebral cortex. 1 μg of flagellin (FLA) was injected intrathecally into C57BL/6 mice (n = 4), while PBS served as control (n = 4). a After 3 d, brain sections were stained with NeuN antibody and DAPI, and representative images are shown (scale bar, 50 μm). b The density of NeuN-positive cells in the cerebral cortex was assessed. c Sections were stained with active caspase-3 antibody (images are not shown), and caspase-3-positive cells in the cerebral cortex were quantified. d Sections were immunostained with Iba1 antibody and DAPI, and e Iba1-positive cells in the cerebral cortex were quantified. Results are presented as mean ± SEM. Data were analyzed by Student’s t-test and provided indicated P values

Similar articles

Cited by

References

    1. Al-Obaidi MMJ, Desa MNM. Mechanisms of blood brain barrier disruption by different types of bacteria, and bacterial-host interactions facilitate the bacterial pathogen invading the brain. Cell Mol Neurobiol. 2018;38:1349–1368. doi: 10.1007/s10571-018-0609-2. - DOI - PubMed
    1. Bao W, Wang Y, Fu Y, Jia X, Li J, Vangan N, Bao L, Hao H, Wang Z. mTORC1 regulates flagellin-induced inflammatory response in macrophages. PLoS ONE. 2015;10:e0125910. doi: 10.1371/journal.pone.0125910. - DOI - PMC - PubMed
    1. Bernardino AL, Myers TA, Alvarez X, Hasegawa A, Philipp MT. Toll-like receptors: insights into their possible role in the pathogenesis of lyme neuroborreliosis. Infect Immun. 2008;76:4385–4395. doi: 10.1128/IAI.00394-08. - DOI - PMC - PubMed
    1. Bsibsi M, Ravid R, Gveric D, van Noort JM. Broad expression of Toll-like receptors in the human central nervous system. J Neuropathol Exp Neurol. 2002;61:1013–1021. doi: 10.1093/jnen/61.11.1013. - DOI - PubMed
    1. Buonfiglioli A, Efe IE, Guneykaya D, Ivanov A, Huang Y, Orlowski E, Kruger C, Deisz RA, Markovic D, Fluh C, et al. let-7 microRNAs regulate microglial function and suppress glioma growth through Toll-Like Receptor 7. Cell Rep. 2019;29(3460–3471):e3467. doi: 10.1016/j.celrep.2019.11.029. - DOI - PubMed

Publication types

LinkOut - more resources

  NODES
Association 2
chat 1
twitter 2