. 2020 Aug 7;10(17):9326-9338.
doi: 10.1002/ece3.6619. eCollection 2020 Sep.

Virulence phenotypes result from interactions between pathogen ploidy and genetic background

Affiliations

Virulence phenotypes result from interactions between pathogen ploidy and genetic background

Dorian J Feistel et al. Ecol Evol. .

Abstract

Studying fungal virulence is often challenging and frequently depends on many contexts, including host immune status and pathogen genetic background. However, the role of ploidy has often been overlooked when studying virulence in eukaryotic pathogens. Since fungal pathogens, including the human opportunistic pathogen Candida albicans, can display extensive ploidy variation, assessing how ploidy impacts virulence has important clinical relevance. As an opportunistic pathogen, C. albicans causes nonlethal, superficial infections in healthy individuals, but life-threatening bloodstream infections in individuals with compromised immune function. Here, we determined how both ploidy and genetic background of C. albicans impacts virulence phenotypes in healthy and immunocompromised nematode hosts by characterizing virulence phenotypes in four near-isogenic diploid and tetraploid pairs of strains, which included both laboratory and clinical genetic backgrounds. We found that C. albicans infections decreased host survival and negatively impacted host reproduction, and we leveraged these two measures to survey both lethal and nonlethal virulence phenotypes across the multiple C. albicans strains. In this study, we found that regardless of pathogen ploidy or genetic background, immunocompromised hosts were susceptible to fungal infection compared to healthy hosts. Furthermore, for each host context, we found a significant interaction between C. albicans genetic background and ploidy on virulence phenotypes, but no global differences between diploid and tetraploid pathogens were observed.

Keywords: fungi; pathogen; ploidy; virulence.


Conflict of interest statement

The author(s) declare no competing interests.

Figures
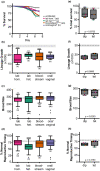
FIGURE 1
FIGURE 1
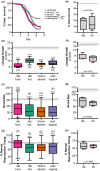
Candida albicans genetic background differentially impacts healthy host fitness. (a) Survival curves for healthy, wild‐type nematode host populations that were either uninfected (exposed only to an Escherichia coli food source, gray), or infected with different C. albicans strains (indicated in legend). Error bars indicated ± SE. The number of hosts analyzed (n) for each treatment is indicated in Table S1. Statistical significance was tested using pairwise comparisons of survival curves with the Log‐rank (Mantel–Cox) test. Asterisks denote statistical significance compared to the uninfected control (* indicates p < .05; **** indicates p < .0001). Candida albicans treatments that share letters are not significantly different, whereas treatments with differing letters are statistically different. (b) Box and whiskers plot of host lineage growth, represented by the total population size of F1 and F2 progeny from a single founder host, produced within 7 days. Boxes indicated the 25th–75th quartiles with the mean indicated as a line. Error bars are the normalized data range and circles indicate outliers. The mean and 95% CI of the uninfected control treatment is indicated by the gray dashed line and shaded gray box, respectively. Statistical significance was tested using one‐way ANOVA. Asterisks denote statistical differences compared to the uninfected control (* indicates p < .05; *** indicates p < .001). Candida albicans treatments that share letters are not significantly different, whereas treatments with differing letters are statistically different, post hoc Dunn's multiple comparison test. (c)Total brood size and (d) percent of host progeny produced during days 1–3 of adulthood (normal reproductive timing) of hosts infected with C. albicans. Data and statistical analyses are the same as (b). (e) Percent host survival on Day 7 for diploid (dip) and tetraploid (tet) C. albicans strains (colored symbols indicate specific C. albicans genetic background). Statistical significance was tested using Wilcoxon matched‐pairs signed rank test and p‐values are indicated. (f) Lineage growth, (g) brood size, and (h) reproductive timing of hosts infected with C. albicans diploid and tetraploid strains. Data and statistical analysis are the same as for (e)
FIGURE 2
FIGURE 2
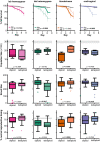
Ploidy‐specific differences across Candida albicans genetic backgrounds in healthy hosts. (a) Survival curves for healthy, wild‐type nematode host populations that were either uninfected (exposed only to an Escherichia coli food source, gray), or infected with diploid or tetraploid C. albicans strains from laboratory homozygous (pink), laboratory heterozygous (green), bloodstream (orange), or oral/vaginal (blue) genetic backgrounds. Error bars indicated ± SE. Statistical significance was tested using pairwise comparisons of diploidy and tetraploid survival curves with the Log‐rank (Mantel–Cox) test and values are indicated with significant differences highlighted in bolded text. (b) Box and whiskers plot of host lineage growth, represented by the total population size of F1 and F2 progeny from a single founder host, produced within 7 days. Boxes indicated the 25th–75th quartiles with the mean indicated as a line. Error bars are the normalized data range and circles indicate outliers. The mean and 95% CI of the uninfected control treatment is indicated by the gray dashed line and shaded gray box, respectively. Statistical significance between diploid and tetraploid strains was tested using Mann–Whitney test, and p‐values are indicated with significant differences highlighted in bolded text. (c) Total brood size and (d) percent of host progeny produced during days 1–3 of adulthood (normal reproductive timing) of hosts infected with diploid and tetraploid C. albicans. Data and statistical analyses are the same as (b)
FIGURE 3
FIGURE 3
Immunocompromised hosts are highly susceptible to Candida albicans infection regardless of genetic background or ploidy. (a) Survival curves for immunocompromised, sek‐1 nematode host populations that were either uninfected (exposed only to an Escherichia coli food source, gray), or infected with different C. albicans strains (indicated in legend). Error bars indicated ± SE. The number of hosts analyzed (n) for each treatment is indicated in Table S1. Statistical significance was tested using pairwise comparisons of survival curves with the Log‐rank (Mantel–Cox) test. Asterisks denote statistical significance compared to the uninfected control (* indicates p < .05; **** indicates p < .0001). Candida albicans treatments that share letters are not significantly different, whereas treatments with differing letters are statistically different. (b) Box and whiskers plot of host lineage growth, represented by the total population size of F1 and F2 progeny from a single founder sek‐1 host, produced within 7 days. Boxes indicated the 25th–75th quartiles with the mean indicated as a line. Error bars are the normalized data range and circles indicate outliers. The mean and 95% CI of the uninfected control treatment is indicated by the gray dashed line and shaded gray box, respectively. Statistical significance was tested using one‐way ANOVA. Asterisks denote statistical differences compared to the uninfected control (* indicates p < .05; *** indicates p < .001). Candida albicans treatments that share letters are not significantly different, whereas treatments with differing letters are statistically different, post hoc Dunn's multiple comparison test. (c) Total brood size and (d) percent of host progeny produced during days 1–3 of adulthood (normal reproductive timing) of sek‐1 hosts infected with C. albicans. Data and statistical analyses are the same as (b). (e) Percent sek‐1 host survival on Day 7 for diploid (dip) and tetraploid (tet) C. albicans strains (colored symbols indicate specific C. albicans genetic background). Statistical significance was tested using Wilcoxon matched‐pairs signed rank test, and p‐values are indicated. (f) Lineage growth, (g) brood size, and (h) reproductive timing of sek‐1 hosts infected with C. albicans diploid and tetraploid strains. Data and statistical analysis are the same as for (e)
FIGURE 4
FIGURE 4
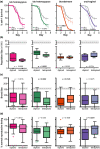
Ploidy‐specific differences across Candida albicans genetic backgrounds in immunocompromised hosts. (a) Survival curves for immunocompromised, sek‐1 nematode host populations that were either uninfected (exposed only to an Escherichia coli food source, gray), or infected with diploid or tetraploid C. albicans strains from laboratory homozygous (pink), laboratory heterozygous (green), bloodstream (orange), or oral/vaginal (blue) genetic backgrounds. Error bars indicated ± SE. Statistical significance was tested using pairwise comparisons of diploidy and tetraploid survival curves with the Log‐rank (Mantel–Cox) test, and p‐values are indicated with significant differences highlighted in bolded text. (b) Box and whiskers plot of host lineage growth, represented by the total population size of F1 and F2 progeny from a single sek‐1 founder host, produced within 7 days. Boxes indicated the 25th–75th quartiles with the mean indicated as a line. Error bars are the normalized data range and circles indicate outliers. The mean and 95% CI of the uninfected control treatment is indicated by the gray dashed line and shaded gray box, respectively. Statistical significance between diploid and tetraploid strains was tested using Mann–Whitney test, and p‐values are indicated with significant differences highlighted in bolded text. (c) Total brood size and (d) percent of sek‐1 host progeny produced during days 1–3 of adulthood (normal reproductive timing) of hosts infected with diploid and tetraploid C. albicans. Data and statistical analyses are the same as (b)
FIGURE 5
FIGURE 5
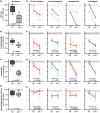
Ploidy‐specific interactions between healthy and immunocompromised hosts. (a) Relative impact on Day 7 host survival (infected/uninfected) for all Candida albicans strains (colored symbols indicate specific C. albicans genetic background) in healthy (N2) and immunocompromised (sek‐1) hosts. The mean and 95% CI of the uninfected control treatment are indicated by the gray dashed line and shaded box, respectively. Statistical significance between host genotypes was tested using Wilcoxon matched‐pairs signed rank test, and p‐values are indicated. (b) Box and whiskers plot of relative host lineage growth (c) Brood size, and (d) Reproductive timing between healthy and immunocompromised hosts. Data and statistical analysis were the same as in (a). (e) Relative impact of C. albicans ploidy on host survival per pathogen genetic background. Relative virulence of diploid (solid lines) and tetraploid (dotted lines) C. albicans laboratory homozygous (pink), laboratory heterozygous (green), bloodstream (orange), and oral/vaginal (blue) genetic background in healthy (N2) and immunocompromised (sek‐1) hosts. Y‐axis scale bar is the same as in (a). (f) Relative host lineage growth, (g) Brood size, and (h) Reproductive timing between healthy (N2) and immunocompromised (sek‐1) hosts across C. albicans genetic backgrounds. Symbols represent the mean value and error bars indicate ± one standard deviation. Y‐axis scale bar is the same as in (b, c, and d). Statistical significance was tested by two‐way ANOVA, and the “interaction” p‐values are indicated with significant differences highlighted in bolded text

Similar articles

Cited by

References

    1. Abbey, D. A. , Funt, J. , Lurie‐Weinberger, M. N. , Thompson, D. A. , Regev, A. , Myers, C. L. , & Berman, J. (2014). YMAP: A pipeline for visualization of copy number variation and loss of heterozygosity in eukaryotic pathogens. Genome Medicine, 6, 100 10.1186/PREACCEPT-1207699561372700 - DOI - PMC - PubMed
    1. Abbey, D. , Hickman, M. , Gresham, D. , & Berman, J. (2011). High‐resolution SNP/CGH microarrays reveal the accumulation of loss of heterozygosity in commonly used Candida albicans strains. G3: Genes, Genomes, Genetics, 1, 523–530. - PMC - PubMed
    1. Arbour, M. , Epp, E. , Hogues, H. , Sellam, A. , Lacroix, C. , Rauceo, J. , … Nantel, A. (2009). Widespread occurrence of chromosomal aneuploidy following the routine production of Candida albicans mutants. FEMS Yeast Research, 9, 1070–1077. - PMC - PubMed
    1. Bennett, R. J. , & Johnson, A. D. (2003). Completion of a parasexual cycle in Candida albicans by induced chromosome loss in tetraploid strains. EMBO Journal, 22, 2505–2515. 10.1093/emboj/cdg235 - DOI - PMC - PubMed
    1. Bensasson, D. , Dicks, J. , Ludwig, J. M. , Bond, C. J. , Elliston, A. , Roberts, I. N. , & James, S. A. (2019). Diverse lineages of Candida albicans live on old Oaks. Genetics, 211, 277–288. - PMC - PubMed
  NODES
Note 4
twitter 2