Bayesian hierarchical dose-response meta-analysis of epidemiological studies: Modeling and _target population prediction methods
- PMID: 32971419
- PMCID: PMC7780081
- DOI: 10.1016/j.envint.2020.106111
Bayesian hierarchical dose-response meta-analysis of epidemiological studies: Modeling and _target population prediction methods
Abstract
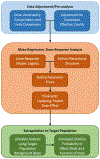
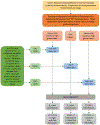
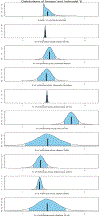
When assessing the human risks due to exposure to environmental chemicals, traditional dose-response analyses are not straightforward when there are numerous high-quality epidemiological studies of priority cancer and non-cancer health outcomes. Given this wealth of information, selecting a single "best" study on which to base dose-response analyses is difficult and would potentially ignore much of the available data. Therefore, systematic approaches are necessary for the analysis of these rich databases. Examples are meta-analysis (and further, meta-regression), which are well established methods that consider and incorporate information from multiple studies into the estimation of risks due to exposure to environmental contaminants. In this paper, we propose a hierarchical, Bayesian meta-analysis approach for the dose-response analysis of multiple epidemiological studies. This paper is the second of two papers detailing this approach; the first covered "pre-analysis" steps necessary to prepare the data for dose-response modeling. This paper focuses on the hierarchical Bayesian approach to dose-response modeling and extrapolation of risk to populations of interest using the association between bladder cancer and oral inorganic arsenic (iAs) exposure as an illustrative case study. In particular, this paper addresses the modeling of both case-control and cohort studies with a flexible, logistic model in a hierarchical Bayesian framework that estimates study-specific slopes, as well as a pooled slope across all studies. This approach is akin to a random effects model in which no assumption is made a priori that there is a single, common slope for all included studies. Further, this paper also details extrapolation of the estimates of logistic slope to extra risk in a _target population using a lifetable analysis and basic assumptions about background iAs exposure levels. In this case, the _target population was the general United States population and information on all-cause mortality and incidence and mortality from bladder cancer was used to perform the lifetable analysis. The methods herein were developed for general use in investigating the association between any pollutant and observed health-effects in epidemiological studies. In order to demonstrate these methods, inorganic arsenic was chosen as a case study given the large epidemiological database that exists for this contaminant.
Keywords: Bayesian dose-response; Hierarchical model; Lifetable analysis; Meta-analysis.
Published by Elsevier Ltd.
Figures


Similar articles
-
Systematic dose-response of environmental epidemiologic studies: Dose and response pre-analysis.Environ Int. 2020 Sep;142:105810. doi: 10.1016/j.envint.2020.105810. Epub 2020 Jun 17. Environ Int. 2020. PMID: 32563010 Free PMC article.
-
[Meta-analysis of the Italian studies on short-term effects of air pollution].Epidemiol Prev. 2001 Mar-Apr;25(2 Suppl):1-71. Epidemiol Prev. 2001. PMID: 11515188 Italian.
-
Mortality and Morbidity Effects of Long-Term Exposure to Low-Level PM2.5, BC, NO2, and O3: An Analysis of European Cohorts in the ELAPSE Project.Res Rep Health Eff Inst. 2021 Sep;2021(208):1-127. Res Rep Health Eff Inst. 2021. PMID: 36106702 Free PMC article.
-
Sutureless Aortic Valve Replacement for Treatment of Severe Aortic Stenosis: A Single Technology Assessment of Perceval Sutureless Aortic Valve [Internet].Oslo, Norway: Knowledge Centre for the Health Services at The Norwegian Institute of Public Health (NIPH); 2017 Aug 25. Report from the Norwegian Institute of Public Health No. 2017-01. Oslo, Norway: Knowledge Centre for the Health Services at The Norwegian Institute of Public Health (NIPH); 2017 Aug 25. Report from the Norwegian Institute of Public Health No. 2017-01. PMID: 29553663 Free Books & Documents. Review.
-
Low-Dose Aspirin for the Prevention of Morbidity and Mortality From Preeclampsia: A Systematic Evidence Review for the U.S. Preventive Services Task Force [Internet].Rockville (MD): Agency for Healthcare Research and Quality (US); 2014 Apr. Report No.: 14-05207-EF-1. Rockville (MD): Agency for Healthcare Research and Quality (US); 2014 Apr. Report No.: 14-05207-EF-1. PMID: 24783270 Free Books & Documents. Review.
Cited by
-
Using Prior Toxicological Data to Support Dose-Response Assessment─Identifying Plausible Prior Distributions for Dichotomous Dose-Response Models.Environ Sci Technol. 2022 Nov 15;56(22):16506-16516. doi: 10.1021/acs.est.2c05872. Epub 2022 Oct 24. Environ Sci Technol. 2022. PMID: 36279400 Free PMC article.
-
Benchmark dose modeling for epidemiological dose-response assessment using prospective cohort studies.Risk Anal. 2024 Apr;44(4):743-756. doi: 10.1111/risa.14196. Epub 2023 Jul 27. Risk Anal. 2024. PMID: 37496455
-
Use of study-specific MOE-like estimates to prioritize health effects from chemical exposure for analysis in human health assessments.Environ Int. 2020 Nov;144:105986. doi: 10.1016/j.envint.2020.105986. Epub 2020 Aug 30. Environ Int. 2020. PMID: 32871380 Free PMC article.
References
-
- ATSDR (Agency for Toxic Substances and Disease Registry). (2007). Toxicological profile for arsenic (update) [ATSDR Tox Profile]. Atlanta, GA: U.S. Department of Health and Human Services, Public Health Service. http://www.atsdr.cdc.gov/toxprofiles/tp.asp?id=22&tid=3
-
- ATSDR (Agency for Toxic Substances and Disease Registry). (2016). Addendum to the toxicological profile for arsenic [ATSDR Tox Profile]. Atlanta, GA: Agency for Toxic Substances and Disease Registry, Division of Toxicology and Human Health Sciences. https://www.atsdr.cdc.gov/toxprofiles/Arsenic_addendum.pdf
-
- Bagnardi V, Zambon A, Quatto P and Corrao G, 2004. Flexible meta-regression functions for modeling aggregate dose-response data, with an application to alcohol and mortality. American journal of epidemiology, 159(11), pp.1077–1086. - PubMed
-
- Bates MN; Rey OA; Biggs ML; Hopenhayn C; Moore LE; Kalman D; Steinmaus C; Smith AH Case-control study of bladder cancer and exposure to arsenic in Argentina. Am J Epidemiol 2004;159:381–389 - PubMed
Publication types
MeSH terms
Substances
Grants and funding
LinkOut - more resources
Full Text Sources

