. 2020 Sep 26;11(9):812.
doi: 10.1038/s41419-020-03013-8.

Brca2 deficiency drives gastrointestinal tumor formation and is selectively inhibited by mitomycin C

Affiliations

Brca2 deficiency drives gastrointestinal tumor formation and is selectively inhibited by mitomycin C

Xiaomin Chen et al. Cell Death Dis. .

Abstract

BRCA2 is crucial for repairing DNA double-strand breaks with high fidelity, and loss of BRCA2 increases the risks of developing breast and ovarian cancers. Herein, we show that BRCA2 is inactively mutated in 10% of gastric and 7% of colorectal adenocarcinomas, and that this inactivation is significantly correlated with microsatellite instability. Villin-driven Brca2 depletion promotes mouse gastrointestinal tumor formation when genome instability is increased. Whole-genome screening data showed that these BRCA2 monoallelic and biallelic mutant tumors were selectively inhibited by mitomycin C. Mechanistically, mitomycin C provoked double-strand breaks in cancer cells that often recruit wild-type BRCA2 for repair; the failure to repair double-strand breaks caused cell-cycle arrest at the S phase and p53-mediated cell apoptosis of BRCA2 monoallelic and biallelic mutant tumor cells. Our study unveils the role of BRCA2 loss in the development of gastrointestinal tumors and provides a potential therapeutic strategy to eliminate BRCA2 monoallelic and biallelic mutant tumors through mitomycin C.


Conflict of interest statement

The authors declare that they have no conflict of interest.

Figures
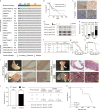
Fig. 1
Fig. 1. Brca2 depletion in Villin-positive cells promotes gastrointestinal cancer formation by increasing genome instability.
a Mutation status of FA- and FA-like members in 2014 TCGA stomach adenocarcinoma samples (n = 293). MSI, high microsatellite instability; GS, genomic stable; EBV, Epstein-Barr virus positivity; CIN, chromosomal instability. b Survival curves of BRCA2-low (n = 209) and BRCA2-high (n = 145) mRNA expression cases from provisional TCGA gastric cancer databases. *p < 0.05. c Brca2 staining in the stomach tissues of Brca2 wild-type and knockout mice. Scale bar, 10 μm. d Experimental design: Three-week-old Brca2 knockout mice or littermate wild-type mice were divided into four groups; MNU was administered to mice in two groups via drinking water at 120 mg/L on alternate weeks for a total exposure of 10 weeks, and vehicle was administered to the other two groups. e Disease incidence of Villin-Cre; Brca2fl/fl mice (n = 10, WT group), Villin-Cre+; Brca2fl/fl (n = 12, KO group), Villn-Cre; Brca2fl/fl with MNU (n = 16, WT plus MNU group), and Villin-Cre+; Brca2fl/fl with MNU (n = 18, KO plus MNU group). f Tumor incidence and location of all the tested mice in the four groups. g Kaplan–Meier survival curves of Brca2 wild-type (n = 10) and knockout mice (n = 12) without MNU treatment. h Kaplan–Meler survival curves of Brca2 wild-type (n = 8) and knockout mice (n = 6) with MNU treatment. **p < 0.01. i Gross morphology and H&E staining of stomach sections from 10-month-old MNU-treated Brca2 wild-type and knockout mice. The white arrow indicates the visible tumors of Brca2 knockout mice. Scale bar, 200 μm. j Disease incidence and location of Villin-Cre+; Brca2+/+; Trp53fl/+ mice (Group A, n = 5) and Villin-Cre+; Brca2fl/fl; Trp53fl/+ mice (Group B, n = 9). k Kaplan–Meier survival curves of Villin-Cre+; Brca2+/+; Trp53fl/+ and Villin-Cre+; Brca2fl/fl; Trp53fl/+ mice. *p < 0.05.
Fig. 2
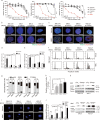
Fig. 2. MMC induces DSBs and shows potent killing effects in BRCA2 monoallelic and biallelic mutant tumor cells.
a After SNU-1, SNU-5 and HGC-27 cells were treated with the indicated drugs for 72 h, the cell viability was determined at OD570, with normalization to DMSO treatment. b Representative images of γ-H2AX and BRCA2 foci formation in BRCA2 wild-type and mutant cell lines after treated with 0.3 μM MMC for 18 h. Scale bar, 10 μm. c Representative images of γ-H2AX and RAD51 foci formation in BRCA2 wild-type and mutant cell lines after treatment with 0.3 μM MMC or vehicle for 18 h. Scale bar, 10 μm. d The quantification of γ-H2AX and BRCA2 foci formation in BRCA2 wild-type and mutant cell lines in the absence and presence of 0.3 μM MMC treatment for 18 h. e The quantification of γ-H2AX and RAD51 foci formation in BRCA2 wild-type and mutant cell lines after treatment with 0.3 μM MMC or vehicle for 18 h. f The flow cytometry data of SNU-216, SNU-1, SNU-5, and HGC-27 after treatment with 0.1% DMSO or 1 μM MMC for 24 h. g The cell-cycle phases of SNU-216, SNU-1, SNU-5, and HGC-27 were presented after treatment with 0.1% DMSO or 1 μM MMC for 24 h. h The relative S phases of SNU-216, SNU-1, SNU-5, and HGC-27 were calculated and statistical analyzed after treatment with 0.1% DMSO or 1 μM MMC for 24 h. i Single-cell electrophoresis in the indicated cell lines after treatment with 3 μM MMC or vehicle for 36 h. Scale bar, 10 μm. j Quantification of single-cell electrophoresis in indicated cell lines. k Immunoblotting analysis of γ-H2AX, PARP and cleaved-PARP in the indicated cell lines after treatment with 0.3 μM MMC for 18 h plus withdrawal for 24 h. Data represent the mean ± SD of 3–5 replicates, *p < 0.05, **p < 0.01, ***p < 0.001, ****p < 0.0001.
Fig. 3
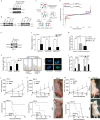
Fig. 3. Whole-genome screening reveals that MMC eliminates BRCA2-mutant gastrointestinal tumor by _targeting BRCA2.
a The BRCA2 protein expression in BRCA2 wild-type and mutant gastrointestinal tumor cell lines was shown by immunoblotting. b The BRCA2 protein expression was determined in SNU-1 and HGC-27 cell lines by immunoblotting after treatment with the indicated drugs. c Working flowchart of genome-scale CRISPR-Cas9 knockout (GeCKO) screening. d CRISPR score analysis data showed that BRCA2 knockout selectively sensitized SNU-1 cells to MMC treatment, but did not affect the viability of SNU-1 cells when treated with vehicle. e The knockout efficiency of BRCA2 protein was determined by immunoblotting. f sgBRCA2 and sgControl SNU-1 cells were treated with 0.1 μM MMC or 0.1% DMSO for 72 h, respectively, and the cell viability was determined at OD570. g Primary tumor cells derived from tumor tissues of Villin-Cre+; Brca2fl/fl mice (#1305) were treated with 0.1 and 1 μM MMC or 0.1% DMSO for 72 h. h Cell viability, expression status of BRCA2 and foci formation in HGC-27 cells treated with MMC after introduction with wild-type BRCA2 or control vector. Scale bar, 10 μm. i The viability of SNU-1 and SNU-5 cells in the absence or presence of wild-type BRCA2 was determined when treatment with 0.1 μM MMC for 72 h, 0.1% DMSO was used as a control. j Tumor volume and survival rate of Rag2−/−;Il2r−/ mice harboring SNU-1 tumor xenografts. Mice were intraperitoneally treated with vehicle or 1 mg/kg MMC, once per week for total four weeks, n = 5. k Tumor volume and survival rate of nude mice with SNU-5 tumor xenografts. Mice were intraperitoneally treated with vehicle or 1 mg/kg MMC, once per week for total four weeks, n = 5. l Representative images of SNU-5 tumor-bearing nude mice after 3 weeks of vehicle or MMC treatment. m Tumor volume and survival rate of nude mice with HGC-27 tumor xenografts. Mice were intraperitoneally treated with vehicle or 1 mg/kg MMC, once per week for total 4 weeks, n = 5. n Representative images of HGC-27 tumor-bearing nude mice after three weeks of vehicle or MMC treatment. Data represent the mean ± SD, *p < 0.05, **p < 0.01, ***p < 0.01, ****p < 0.0001.
Fig. 4
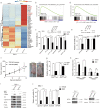
Fig. 4. p53 is responsible for MMC-induced apoptosis of BRCA2 monoallelic and biallelic mutant cells.
a Nonbiased clustering of the top 20 up and downregulated genes by comparison MMC-treated to DMSO-treated SNU-1 cells. b Gene set enrichment analysis of the gene signature of the p53 pathway in SNU-1 cells treated with 3 μM MMC or 0.1% DMSO for 36 h. c SNU-1 sgTP53, sgControl and p53-putback cells were treated with 0.3 μM MMC or 0.1% DMSO for 72 h, and cell viability was determined at OD570. The knockout effect of p53 protein is shown in the upper panel. d Gene set enrichment analysis of the gene signature of the p53 pathway in SNU-1 (TP53 WT) and SNU-1(TP53 KO) cells treated with 3 μM MMC for 36 h. e HCT116 sgTP53 and sgControl cells were treated with 0.1 μM MMC or 0.1% DMSO for 72 h, and the cell viability was determined at OD570. The knockout effects of p53 protein are shown in the upper panel. f Tumor volume of SNU-1 (TP53 KO) tumor xenografts in nude mice. Mice were intraperitoneally treated with vehicle or 3 mg/kg MMC, once per week for a total of four weeks, n = 5. Representative images are shown on the right. g Cell viability of primary cancer cells derived from Villin-Cre+; Brca2fl/fl; Trp53+/+ mouse or Villin-Cre+; Brca2fl/fl; Trp53fl/+ mice treated with 1 μM MMC or 0.1% DMSO for 72 h. h RT-qPCR analysis of NOXA and PUMA mRNA levels in SNU-1 sgControl and sgTP53 cells when treated with 3 μM MMC or 0.1% DMSO for 24 h. i Immunoblotting analysis of PARP, cleaved-PARP, p53, p-p53(ser15), NOXA and PUMA of sgControl and sgTP53 SNU-1 cells. Cells were treated with 3 μM MMC or 0.1% DMSO for 36 h. j Cell viability of the SNU-1 NOXA knockout cell line, control cell line (sgControl), SNU-1 PUMA KD cell line and control cell line (Scramble) treated with 0.1 μM MMC or 0.1% DMSO for 72 h. Cell viability was determined at OD570. The knockout effects of NOXA and knockdown effects of PUMA are shown on the right. Data are presented as the mean ± SD of 3–5 replicates, **p < 0.01, ***p < 0.001, ****p < 0.0001.

Similar articles

Cited by

References

    1. Ceccaldi R, Rondinelli B, D’Andrea AD. Repair pathway choices and consequences at the double-strand break. Trends Cell Biol. 2016;26:52–64. - PMC - PubMed
    1. Wong AK, Pero R, Ormonde PA, Tavtigian SV, Bartel PL. RAD51 interacts with the evolutionarily conserved BRC motifs in the human breast cancer susceptibility gene brca2. J. Biol. Chem. 1997;272:31941–31944. - PubMed
    1. Davies AA, et al. Role of BRCA2 in control of the RAD51 recombination and DNA repair protein. Mol. Cell. 2001;7:273–282. - PubMed
    1. Patel KJ, et al. Involvement of Brca2 in DNA repair. Mol. Cell. 1998;1:347–357. - PubMed
    1. Roy R, Chun J, Powell SN. BRCA1 and BRCA2: different roles in a common pathway of genome protection. Nat. Rev. Cancer. 2011;12:68–78. - PMC - PubMed

Publication types

  NODES
admin 2
twitter 2