Characterization of DNA Methylation Patterns and Mining of Epigenetic Markers During Genomic Reprogramming in SCNT Embryos
- PMID: 32984351
- PMCID: PMC7492385
- DOI: 10.3389/fcell.2020.570107
Characterization of DNA Methylation Patterns and Mining of Epigenetic Markers During Genomic Reprogramming in SCNT Embryos
Abstract
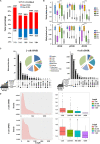
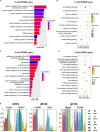
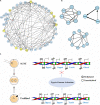
Somatic cell nuclear transfer (SCNT), also known as somatic cell cloning, is a commonly used technique to study epigenetic reprogramming. Although SCNT has the advantages of being safe and able to obtain pluripotent cells, early developmental arrest happens in most SCNT embryos. Overcoming epigenetic barriers is currently the primary strategy for improving reprogramming efficiency and improving developmental rate in SCNT embryos. In this study, we analyzed DNA methylation profiles of in vivo fertilized embryos and SCNT embryos with different developmental fates. Overall DNA methylation level was higher in SCNT embryos during global de-methylation process compared to in vivo fertilized embryos. In addition, promoter region, first intron and 3'UTR were found to be the major genomic regions that were hyper-methylated in SCNT embryos. Surprisingly, we found the length of re-methylated region was directly related to the change of methylation level. Furthermore, a number of genes including Dppa2 and Dppa4 which are important for early zygotic genome activation (ZGA) were not properly activated in SCNT embryos. This study comprehensively analyzed genome-wide DNA methylation patterns in SCNT embryos and provided candidate _target genes for improving efficiency of genomic reprogramming in SCNT embryos. Since SCNT technology has been widely used in agricultural and pastoral production, protection of endangered animals, and therapeutic cloning, the findings of this study have significant importance for all these fields.
Keywords: DNA methylation; SCNT; WGCNA; ZGA; epigenetic reprogramming.
Copyright © 2020 Cao, Li, Zuo and Nashun.
Figures


Similar articles
-
Aberrant DNA and histone methylation during zygotic genome activation in goat cloned embryos.Theriogenology. 2020 May;148:27-36. doi: 10.1016/j.theriogenology.2020.02.036. Epub 2020 Feb 24. Theriogenology. 2020. PMID: 32126393
-
Dynamic Methylation Changes of DNA and H3K4 by RG108 Improve Epigenetic Reprogramming of Somatic Cell Nuclear Transfer Embryos in Pigs.Cell Physiol Biochem. 2018;50(4):1376-1397. doi: 10.1159/000494598. Epub 2018 Oct 24. Cell Physiol Biochem. 2018. PMID: 30355946
-
Transient Dux expression facilitates nuclear transfer and induced pluripotent stem cell reprogramming.EMBO Rep. 2020 Sep 3;21(9):e50054. doi: 10.15252/embr.202050054. Epub 2020 Jul 27. EMBO Rep. 2020. PMID: 32715614 Free PMC article.
-
_targeting cellular memory to reprogram the epigenome, restore potential, and improve somatic cell nuclear transfer.Anim Reprod Sci. 2007 Mar;98(1-2):129-46. doi: 10.1016/j.anireprosci.2006.10.019. Epub 2006 Oct 21. Anim Reprod Sci. 2007. PMID: 17166676 Review.
-
[Advances in epigenetic reprogramming of somatic cells nuclear transfer in mammals].Yi Chuan. 2019 Dec 20;41(12):1099-1109. doi: 10.16288/j.yczz.19-193. Yi Chuan. 2019. PMID: 31857281 Review. Chinese.
Cited by
-
TET enzyme driven epigenetic reprogramming in early embryos and its implication on long-term health.Front Cell Dev Biol. 2024 Aug 1;12:1358649. doi: 10.3389/fcell.2024.1358649. eCollection 2024. Front Cell Dev Biol. 2024. PMID: 39149518 Free PMC article. Review.
-
Impacts of Epigenetic Processes on the Health and Productivity of Livestock.Front Genet. 2021 Feb 23;11:613636. doi: 10.3389/fgene.2020.613636. eCollection 2020. Front Genet. 2021. PMID: 33708235 Free PMC article. Review.
-
Overexpression of TICRR and PPIF confer poor prognosis in endometrial cancer identified by gene co-expression network analysis.Aging (Albany NY). 2021 Jan 20;13(3):4564-4589. doi: 10.18632/aging.202417. Epub 2021 Jan 20. Aging (Albany NY). 2021. PMID: 33495413 Free PMC article.
-
Epigenetic manipulation to improve mouse SCNT embryonic development.Front Genet. 2022 Aug 30;13:932867. doi: 10.3389/fgene.2022.932867. eCollection 2022. Front Genet. 2022. PMID: 36110221 Free PMC article. Review.
-
Characterization of DNA Methylation and Screening of Epigenetic Markers in Polycystic Ovary Syndrome.Front Cell Dev Biol. 2021 May 25;9:664843. doi: 10.3389/fcell.2021.664843. eCollection 2021. Front Cell Dev Biol. 2021. PMID: 34113617 Free PMC article.
References
-
- Bao S., Zhao H., Yuan J., Fan D., Zhang Z., Su J., et al. (2019). Computational identification of mutator-derived lncRNA signatures of genome instability for improving the clinical outcome of cancers: a case study in breast cancer. Briefings Bioinform. [Online ahead of print] 10.1093/bib/bbz118 - DOI - PubMed
-
- Bi Y., Tu Z., Zhang Y., Yang P., Guo M., Zhu X., et al. (2020). Identification of ALPPL2 as a Naive Pluripotent State-Specific Surface Protein Essential for Human Naive Pluripotency Regulation. Cell Rep 30 3917-3931.e3915. - PubMed
LinkOut - more resources
Full Text Sources

