. 2021 Jan;178(2):280-297.
doi: 10.1111/bph.15277. Epub 2020 Dec 18.

Identification and characterization of a novel adiponectin receptor agonist adipo anti-inflammation agonist and its anti-inflammatory effects in vitro and in vivo

Affiliations

Identification and characterization of a novel adiponectin receptor agonist adipo anti-inflammation agonist and its anti-inflammatory effects in vitro and in vivo

Wei Qiu et al. Br J Pharmacol. 2021 Jan.

Abstract

Background and purpose: Adiponectin (APN) is an adipokine secreted from adipocytes that binds to APN receptors AdipoR1 and AdipoR2 and exerts an anti-inflammatory response through mechanisms not fully understood. There is a need to develop small molecules that activate AdipoR1 and AdipoR2 and to be used to inhibit the inflammatory response in lipopolysaccharide (LPS)-induced endotoxemia and other inflammatory disorders.

Experimental approach: We designed 10 new structural analogues of an AdipoR agonist, AdipoRon (APR), and assessed their anti-inflammatory properties. Bone marrow-derived macrophages (BMMs) and peritoneal macrophages (PEMs) were isolated from mice. Levels of pro-inflammatory cytokines were measured by reverse transcription and real-time quantitative polymerase chain reaction (qRT-PCR), enzyme-linked immunosorbent assay (ELISA) and microarray in LPS-induced endotoxemia mice and diet-induced obesity (DIO) mice in which systemic inflammation prevails. Western blotting, immunohistochemistry (IHC), siRNA interference and immunoprecipitation were used to detect signalling pathways.

Key results: A novel APN receptor agonist named adipo anti-inflammation agonist (AdipoAI) strongly suppresses inflammation in DIO and endotoxemia mice, as well as in cultured macrophages. We also found that AdipoAI attenuated the association of AdipoR1 and APPL1 via myeloid differentiation marker 88 (MyD88) signalling, thus inhibiting activation of nuclear factor kappa B (NF-κB), mitogen-activated protein kinase (MAPK) and c-Maf pathways and limiting the production of pro-inflammatory cytokines in LPS-induced macrophages.

Conclusion and implications: AdipoAI is a promising alternative therapeutic approach to APN and APR to suppress inflammation in LPS-induced endotoxemia and other inflammatory disorders via distinct signalling pathways.

Keywords: APPL1; AdipoAI; MyD88; c-Maf; inflammation; lipopolysaccharide.


Conflict of interest statement

CONFLICT OF INTEREST

The authors declare no potential conflicts of interest concerning the authorship or publication of this article. All authors have followed the recommendations set out in the BJP editorials.

Figures

FIGURE 1
FIGURE 1
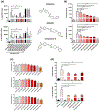
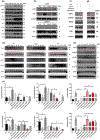
Characterization of anti-inflammatory properties of APR-like compounds. (a) Left: Raw264.7 cells were pretreated with APR (20 μM) or new compounds 1 to 10 (5 μM) for 24 h followed by incubation with LPS (100 ng ml−1) for an additional 6 h. IL-6 and IL-1β mRNA expression levels were evaluated by qPCR and normalized with GAPDH mRNA level. Right: Chemical structures of APR, AdipoAI (compound 3) and Compound 5. (b) Raw264.7 cells were pretreated with different doses of AdipoAI for 24 h followed by incubation with LPS (100 ng ml−1) for additional 6 h to evaluate dose dependency of AdipoAI in inhibiting IL6 and IL-1β mRNA expression levels by qRT-PCR and normalized with GAPDH mRNA level. (c) Evaluation of cytotoxicity of APR, AQ1321 AdipoAI and Compound 5 by CCK8 assay in Raw264.7 cells treated for 24 h. (d) BMMs were pretreated with APR (20 μM), AdipoAI (5 μM) or Compound 5 (5 μM) for 24 h followed by incubation with LPS (100 ng ml−1) for additional 6 h for the measurement of IL-6 and IL-1β mRNA expression levels by qRT-PCR and normalized with GAPDH mRNA level. Data were expressed as the mean ± SEM at five biological independent experiments. One-way ANOVA test for multiple group comparisons, *P < 0.05, significant differences between each indicated group
FIGURE 2
FIGURE 2
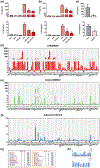
AdipoAI suppresses LPS-stimulated inflammatory responses in macrophages. (a) Raw264.7 cells or (b) BMMs were pretreated with APR (20 μM) or AdipoAI (5 μM) for 24 h followed by incubation with LPS (100 ng ml−1) for additional 6 h for the measurement of IL-6 and IL-1β in supernatants by ELISA. Data were expressed as the mean ± SEM at five biological independent experiments. One-way ANOVA test for multiple group comparisons, * vs. LPS group, *P < 0.05, significant differences between each indicated group. (c) PEMs were isolated from C57BL/6J mice (n = 5 mice/group) were injected i.p. with 1-ml 4% thioglycolate solution or AdipoAI (25 mg kg−1) for the measurement of IL-6 and IL-1β. The amounts of IL-6 and IL-1β in supernatant were measured by ELISA. Data were expressed as the mean ± SEM (n = 5). Two-tailed Student’s t test for two groups, *P < 0.05, significant differences between each indicated group. (d–f) Impact of AdipoAI on (d) basal and LPS-induced expression of an array of (e and f) proinflammatory cytokines, chemokines and receptors in Raw264.7 cells (four groups and three biological replicates/group). Data analyses were performed according to the manufacturer’s instructions with their web-based software package (www.qiagen.com/us/shop/genes-and-pathways/data-analysis-centeroverview-page/). (g) Differentiated expressed genes annotated to a gene-ontology term and example genes by gene-ontology-enrichment analysis of each component. (brown: LPS vs. control; black: Adipo AI + LPS vs. LPS). (h) Differentially expressed M1 and M2 genes are shown according to the microarray databases. No statistical analysis for n = 3
FIGURE 3
FIGURE 3
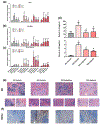
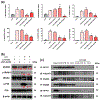
AdipoAI decreases inflammation in DIO mice (n = 6). DIO mice were orally gavaged with APR (50 mg kg−1) or AdipoAI (25 mg kg−1) for 14 days, and control animals (WT or DIO mice) were administered with equivalent volumes of DMSO. mRNA expression levels of proinflammatory cytokines in (a) WAT, (b) spleen and (c) bone marrow were measured by qRT-PCR and normalized to the level of β-actin mRNA. Data are expressed as mean ± SEM. (d) Serum levels of IL-6 and IL-1β were measured by ELISA. Data are expressed as mean ± SEM. Representative images of (e) H&E and (f) IHC of F4/80 staining of spleen tissue in DIO mice (n = 6). Red arrow indicates multinucleated giant cells (megakaryocytes). One-way ANOVA test for multiple group comparisons, * vs. WT vehicle group, # vs. DIO-vehicle group. */#P < 0.05, significant differences between each indicated group. ns, not significant
FIGURE 4
FIGURE 4
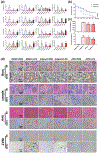
AdipoAI protects against LPS-induced endotoxemia. Endotoxemia was induced in WT mice by intraperitoneal injection with LPS (25 mg kg−1), and control littermates were administered with equivalent volumes of PBS. APR or AdipoAI were orally gavaged into mice for 24 h before LPS challenge and control animals were administered with equivalent volumes of DMSO. (a) mRNA expression levels of pro-inflammatory cytokines in lung, spleen, liver and WAT were measured by qRT-PCR and normalized with GAPDH mRNA levels. Data are shown as mean ± SEM (n = 6). (b) Survival curve of mice with endotoxemia (n = 12). (c) Serum levels of IL-6 and IL-1β were measured by ELISA. Data are expressed as mean ± SEM (n = 6). (d) Histopathology for lung, spleen, liver and WAT tissues isolated from APR- or AdipoAI-treated mice 24 h before LPS challenge (n = 6). Upper panel: hematoxylin and eosin staining; lower panel: immunohistochemical staining for macrophage marker F4/80. Red arrow indicates F4/80 positive cells. One-way ANOVA test for multiplegroup comparisons, * vs. DMSO + PBS group, # vs. DMSO + LPS group. */#P < 0.05, significant differences between each indicated group. ns, not significant
FIGURE 5
FIGURE 5
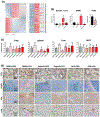
AdipoAI inhibition of NF-κB and p38 MAPK signaling pathways is dependent of AdipoR1/APPL1 axis in LPS-induced macrophages. (a) Impact of AdipoAI in the phosphorylation of related signaling proteins by western blotting. Raw264.7 cells were pretreated with APR (20 μM) or AdipoAI (5 μM) for 24 h followed by incubation with LPS (100 ng ml−1) for an additional 30 min. Representative images are shown, and quantitative analysis of protein expression was performed by densitometric analysis (see lower panel). (b) Expression of p65 protein in cytoplasmic and nuclear extracts of Raw264.7 cells. Representative images of p65 expression are presented along with Lamin B1 and β-actin expression, which were used as internal loading controls. Quantitative analysis of protein expression was performed by densitometric analysis (lower panel). (c) RAW 264.7 cells were transfected with siRNA _targeting either AdipoR1, AdipoR2, APPL1, APPL2 or scrambled control siRNA for 24 h, followed by stimulation with AdipoAI or APR for 24 h, then incubation with LPS for additional 6 h. Transfection efficiency of siRNA and mRNA expression levels of IL-6 and IL-1β were measured by qPCR and normalized with GAPDH mRNA levels. Data were expressed as the mean ± SEM at five biological independent experiments. Oneway ANOVA test for multiple group comparisons, *P < 0.05, significant differences between each indicated group. ns, not significant. (d) RAW 264.7 cells were stimulated with LPS, AdipoAI or APR for different times and proteins levels determined by western blotting. Representative western blotting images are shown along with β-actin used as an internal loading control and densitometric analysis. (e) Raw264.7 cells were pretreated with APR (20 μM) or or AdipoAI (5 μM) for 24 h followed by incubation with LPS (100 ng ml−1) for additional 6 h for the measurement of related proteins by WB. Representative images are shown along with β-actin as an internal loading control and densitometric analysis. (f) Raw264.7 cells and (g) BMMs were transfected with siRNA _targeting APPL1 or scrambled control siRNA for 24 h, followed by stimulation with AdipoAI for 24 h, then incubation with LPS for additional 6 h for western blotting analysis. Representative images are shown along with β-actin as an internal loading control, and densitometric analysis. No statistical analysis of western blotting for n = 3
FIGURE 6
FIGURE 6
(a) RAW 264.7 cells were transfected with siRNA _targeting MyD88, c-Maf or scrambled control siRNA for 24 h, followed by stimulation with LPS for 6 h. (b) Raw264.7 cells were transfected with siRNA _targeting MyD88 or scrambled control siRNA for 24 h, followed by stimulation with LPS for 30 min for measurement of related proteins. Representative images are shown along with β-actin as an internal loading control and densitometric analysis. No statistical analysis of western blotting for n = 3. (c) Raw264.7 cells were pretreated with AdipoAI (5 μM) for 24 h followed by incubation with LPS (100 ng ml−1) for additional 6 h to analyze interactions of AdipoR1, APPL1 and MyD88 by Co-IP experiments. Proteins immunoprecipitated with the anti-APPL1 antibody were subjected to immunoblotting with antibodies to detect APPL1, AdipoR1 and MyD88. Proteins immunoprecipitated with the anti-MyD88 antibody were analyzed by immunoblotting with antibodies for MyD88, APPL1, and AdipoR1. IB, immunoblotting; IP, immunoprecipitation; Input, whole protein lysis as positive control; IgG: rabbit IgG as negative control. P < 0.05, significant differences between each indicated group. ns, not significant
FIGURE 7
FIGURE 7
(a) The cluster heat map shows mRNAs with expression change of more than twofold from microarray data (three biological replicates/group, P < 0.05). (b) Raw264.7 cells were transfected with siRNA _targeting MyD88 or scrambled control siRNA for 24 h, followed by stimulation with LPS for 30 min for measurement of related proteins. Representative images are shown along with β-actin as an internal loading control and densitometric analysis. No statistical analysis of western blotting for n = 3. (c) Raw264.7 cells were pretreated with AdipoAI (5 μM) for 24 h followed by incubation with LPS (100 ng ml) for additional 6 h to analyze interactions of AdipoR1, APPL1 and MyD88 by Co-IP experiments. Proteins immunoprecipitated with the anti-APPL1 antibody were subjected to immunoblotting with antibodies to detect APPL1, AdipoR1 and MyD88. Proteins immunoprecipitated with the anti-MyD88 antibody were analyzed by immunoblotting with antibodies for MyD88, APPL1 and AdipoR1. IB, immunoblotting; IP, immunoprecipitation; Input, whole protein lysis as positive control; IgG: rabbit IgG as negative control. P < 0.05, significant differences between each indicated group. ns, not significant
FIGURE 8
FIGURE 8
Diagram of AdipoAI-elicited molecular mechanisms to inhibit inflammatory responses in LPS-induced macrophages. AdipoAI activates AdipoR1/APPL1 pathways, and MyD88 is recruited to form a protein complex with APPL1, inhibiting activation of IRAK4, NF-κB, MAPK and c-Maf pathways and suppressing production of pro-inflammatory cytokines including IL-6 and IL-1β in LPS-induced macrophages. AdipoAI also inhibit transcriptional activation of c-Maf directly, then suppressing production of IL-6 and IL-1β in macrophages

Similar articles

Cited by

References

    1. Aderem A, & Ulevitch RJ, (2000). Toll-like receptors in the induction of the innate immune response. Nature, 406(6797), 782–787. 10.1038/35021228 - DOI - PubMed
    1. Alexander SP, Christopoulos A, Davenport AP, Kelly E, Mathie A, Peters JA, … CGTP Collaborators. (2019). THE CONCISE GUIDE TO PHARMACOLOGY 2019/20: G protein-coupled receptors. British Journal of Pharmacology, 176, S21–S141. 10.1111/bph.14748 - DOI - PMC - PubMed
    1. Alexander SPH, Roberts RE, Broughton BRS, Sobey CG, George CH, Stanford SC, … Ahluwalia A, (2018). Goals and practicalities of immunoblotting and immunohistochemistry: A guide for submission to the British Journal of Pharmacology. British Journal of Pharmacology, 175, 407–411. 10.1111/bph.14112 - DOI - PMC - PubMed
    1. Barton GM, (2008). A calculated response: control of inflammation by the innate immune system. The Journal of Clinical Investigation, 118(2), 413–420. 10.1172/JCI34431 - DOI - PMC - PubMed
    1. van den Bosch MW, Palsson-Mcdermott E, Johnson DS, & O’Neill LA, (2014). LPS induces the degradation of programmed cell death protein 4 (PDCD4) to release Twist2, activating c-Maf transcription to promote interleukin-10 production. The Journal of Biological Chemistry, 289(33), 22980–22990. 10.1074/jbc.M114.573089 - DOI - PMC - PubMed

Publication types

MeSH terms

  NODES
admin 3
Association 1
INTERN 6
twitter 2