. 2020 Sep 27;12(10):1093.
doi: 10.3390/v12101093.

Thapsigargin at Non-Cytotoxic Levels Induces a Potent Host Antiviral Response that Blocks Influenza A Virus Replication

Affiliations

Thapsigargin at Non-Cytotoxic Levels Induces a Potent Host Antiviral Response that Blocks Influenza A Virus Replication

Leah V Goulding et al. Viruses. .

Abstract

Influenza A virus is a major global pathogen of humans, and there is an unmet need for effective antivirals. Current antivirals against influenza A virus directly _target the virus and are vulnerable to mutational resistance. Harnessing an effective host antiviral response is an attractive alternative. We show that brief exposure to low, non-toxic doses of thapsigargin (TG), an inhibitor of the sarcoplasmic/endoplasmic reticulum (ER) Ca2+ ATPase pump, promptly elicits an extended antiviral state that dramatically blocks influenza A virus production. Crucially, oral administration of TG protected mice against lethal virus infection and reduced virus titres in the lungs of treated mice. TG-induced ER stress unfolded protein response appears as a key driver responsible for activating a spectrum of host antiviral defences that include an enhanced type I/III interferon response. Our findings suggest that TG is potentially a viable host-centric antiviral for the treatment of influenza A virus infection without the inherent problem of drug resistance.

Keywords: antiviral; endoplasmic reticulum stress; influenza A virus; innate immunity; thapsigargin; unfolded protein response.


Conflict of interest statement

The authors declare no conflict of interest.

Figures
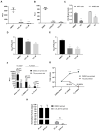
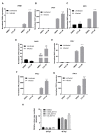
Figure 1
Figure 1
Brief TG priming of NPTr and NHBE cells blocks progeny influenza virus production. (A) NPTr cells and (B) NHBE cells were incubated for 30 min with TG or DMSO control at the indicated concentrations, PBS washed and infected for 12 and 24 h, respectively, with USSR H1N1 virus at 0.5 MOI. Spun supernatants (sns) were used to infect MDCK cells for 6 h in FFAs. Significance determined by one-way ANOVA, relative to DMSO control. (C) NPTr cells and NHBE cells were primed with TG (0.5 and 0.01 µM, respectively) or DMSO for 30 min, and infected with USSR H1N1 virus (0.5 and 1.0 MOI, respectively) for 24 h. Culture media were then harvested to determine presence of viral M-gene RNA. Significance determined by paired t-test. (D,E) MDCK cells were incubated for 30 min with TG or DMSO control at the indicated concentrations, PBS washed and infected for 24 h with (D) equine H3N8 and (E) canine H3N8 virus. TCID50 assay was performed to quantify virus output. Significance determined by one-way ANOVA, relative to DMSO control. (F) P1 sns were derived from 0.5 µM TG or DMSO pre-primed (for 30 min) NPTr cells infected with stock virus (USSR H1N1 at 0.5 MOI) for 23 h. Fresh NPTr cells (P2) pre-primed with respective TG or DMSO were infected with corresponding P1 sns for 23 h. Volume of P1 supernatants used was the same as the starting stock virus volume. Significance based on mixed model analysis was relative to corresponding DMSO pre-primed cells. (G) Total progeny virus yield from initial virus infection on P1 cells, pre-primed with DMSO or TG, followed by sequential infection with P1 supernatants on P2 cells correspondingly pre-primed with DMSO or TG. Significance based on mixed effect analysis was relative to corresponding DMSO pre-primed cells. Log (total virus yield) displayed. Each % refers to reduction in virus output relative to initial virus dose from TG priming. (H) At passage 1 (P1), cells were infected with 20 HA units of USSR H1N1 virus for 2 h, PBS washed and cultured for 3 days in the continuous presence of 0.05 µM TG or DMSO control in serum-free OptiMEM media, supplemented with TPCK trypsin at 0.2 µg/mL. Spun P1 sns were used for the next passage; a total of 10 serial passages were completed. P1 and P10 sns were subsequently used in duplicates to separately infect for 2 h NPTr cells, pre-infection primed for 30 min with 0.5 µM TG or DMSO, washed with PBS and cultured in OptiMEM for a further 22 h, after which harvested sns were used in 6 h FFAs on MDCK cells to determine progeny virus output expressed in percentage where corresponding DMSO control output was set at 100%. Two-way ANOVA, Sidak’s multiple comparisons test, showed no significance (ns) in virus inhibition between P1 and P10 TG-derived sns. Significance determined by Mann Whitney test, relative to corresponding DMSO control. * p <0.05, ** p <0.01, **** p <0.0001. All assays were in triplicates and were performed three times.
Figure 2
Figure 2
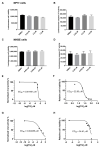
Priming with antiviral concentrations of TG displays no cytotoxicity in respiratory epithelial cells. (A,B) NPTr cells and (C,D) NHBE cells were incubated in indicated concentrations of TG or in DMSO control for 30 min and (A,C) cell viability assays (CellTiter-Glo luminescent cell viability assay) or (B,D) caspase 3/7 activity assays (Caspase-Glo 3/7 assay) performed 24 h later. Significance determined by one-way ANOVA, relative to DMSO control. No significant change in cell viability or caspase activity was found. (E) NHBE cells and (G) NPTr cells were incubated for 30 min in a range of TG concentrations, PBS washed and infected for 24 h with USSR H1N1 virus at 1.0 MOI and 0.5 MOI, respectively. Spun sns were used to infect MDCK cells for 6 h in FFAs. EC50 was calculated from progeny virus output (%) by non-linear regression. (F) NHBE cells and (H) NPTr cells were incubated for 30 min in a range of TG concentrations, PBS washed and cell viability assay (CellTiter-Glo luminescent cell viability assay) performed 24 h later. CC50 was calculated from relative cell viability (%) by non-linear regression. SIs (CC50/EC50) for NHBE and NPTr cells are 15,483 and 8087, respectively.
Figure 3
Figure 3
Continuous exposure of uninfected cells to antiviral doses of TG does not affect cell viability. Cell viability of (A) NPTr cells continuously incubated in the presence of 0.5 μM TG and (B) NHBE cells continuously incubated with 5 nM TG was monitored over 24 h with RealTime-Glo™ MT Cell Viability Assay. Readings indicate duration of TG exposure. Significance based on mixed effect analysis relative to corresponding DMSO control. Cell viability of (C) uninfected NPTr cells and (D) NPTr cells infected with 0.5 MOI USSR H1N1, pre-primed with 0.5 μM TG for 30 min, was monitored with RealTime-Glo™ MT Cell Viability Assay. Readings indicate duration of post mock or influenza virus infection. Significance based on mixed effect analysis relative to corresponding DMSO control. * p < 0.05, ** p < 0.01, *** p < 0.001, **** p < 0.0001.
Figure 4
Figure 4
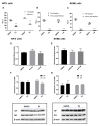
TG promptly induces an extended antiviral state _targeting influenza virus post-translationally. (A) NPTr cells primed with 0.5 µM for 30 min were immediately infected or further cultured for 48 h prior to infection with USSR H1N1 virus at 0.5 MOI for 24 h. Spun sns were used to infect MDCK cells for 6 h in FFAs. Significance determined by paired t-test within each time point. (B) NPTr and (C) NHBE cells were incubated with TG (0.5 and 0.01 µM, respectively) for 30 min and immediately infected (TG pre-infection) or were first infected for 6 h followed by TG exposure for 30 min (TG post-infection). NPTr and NHBE cells were infected with USSR H1N1 virus at 0.5 and 1.0 MOI, respectively. TG pre-primed cells were infected for 2 h, PBS washed and cultured in fresh infection media overnight. Cells 6 h post-infection were treated with TG for 30 min, washed with PBS and cultured in fresh infection media overnight. Spun sns were used to infect MDCK cells for 6 h in FFAs. Significance determined by paired t-test within each time point. (D,F) NPTr primed with (0.5 or 1.0 µM) and (E,G) NHBE cells primed with TG (0.005 or 0.01 µM respectively) were subsequently infected with USSR H1N1 at 0.5 and 1.0 MOI respectively for 24 h. (D,E) Total RNA extracted to determine M gene expression for all samples, normalised to 18S rRNA. Significance determined by one-way ANOVA, relative to DMSO control. (F,G) Protein lysates (DMSO and highest selected TG concentration) harvested at 24 h post-infection were used to ascertain viral NP and M1 protein levels, normalised to beta-actin. Representative blots displayed. Significance determined by paired t-test. * p < 0.05, **** p < 0.0001. All assays were in triplicates and were performed three times.
Figure 5
Figure 5
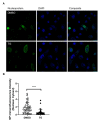
Cytoplasmic NP localisation in TG primed cells. (A) NHBE cells were primed with DMSO or 0.01 μM TG for 30 min, and infected with USSR H1N1 virus at 1.0 MOI for 6 h. Cells were immunostained for viral NP (mouse anti-influenza A virus NP primary antibody detected by donkey anti-mouse IgG H&L conjugated to Alexa Fluor 488 secondary antibody; green fluorescence) and nuclei were stained with DAPI (blue fluorescence). Cells imaged with a Leica TCS SP8 confocal microscope using a 63-time oil immersion objective (scale bar: 25 µm). (B) The ratio of nuclear to cytoplasmic NP fluorescence signal in DMSO and TG-primed NHBE cells was calculated using Fiji (image J). Significance determined by Mann Whitney test, relative to indicated DMSO control. **** p < 0.0001.
Figure 6
Figure 6
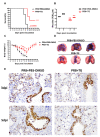
TG in mice confers protection against lethal PR8 H1N1 virus challenge. (A) Survival of mice post-infection treated each day with TG or PBS-DMSO control (n = 10 in each group). Kaplan-Meier survival curves are compared using the log-rank (Mantel-Cox) analysis. (B) Viral titres of lungs from mice treated with TG or PBS-DMSO at 3dpi and 5dpi was determined by TCID50 assays (n = 3 in each group). (C) Mean body weight changes post-infection was determined by daily monitoring (n = 10 in each group). (D) At 5 dpi, entire lungs of TG treated mice displayed much less extensive gross pathology than those of control lungs. Blue outline demarcates boundary between apparent normal and consolidated abnormal tissues. (E) Representative microscopic lung fields, (40-time magnification), derived from similar anatomical sites taken at 3 and 5 dpi, showed that TG treatment resulted in less diffused distribution of viral NP protein (less brown staining), and more frequent localisation of NP than those in corresponding PBS-DMSO controls. Each mouse was infected at 1 × 10² TCID50 of PR8 virus. ** p < 0.01, *** p < 0.001.
Figure 7
Figure 7
ER stress is a driver of host antiviral response to TG priming. (AC) NPTr cells or (DF) NHBE cells were primed with DMSO or TG for 30 min at the indicated concentrations and infected for 24 h with USSR H1N1 virus at 0.5 MOI. Total RNA was extracted from each sample for HSPA5, HSP90B1 and DDIT3 detection, normalised to 18S rRNA. Indicated significance based 2-way RM ANOVA relative to corresponding DMSO control. *p < 0.05 ** p < 0.01, ***p < 0.001 **** p < 0.0001.
Figure 8
Figure 8
TG priming enhanced type I/III IFN-dependent gene expression. (AG) NHBE cells were incubated for 30 min with DMSO or 0.01 µM TG and subsequently infected with USSR H1N1 virus at 0.5 MOI for 24 h. Total RNA was extracted from each sample for type I/III IFN and indicated associated gene expression, normalised to 18S rRNA. Significance determined by two-way ANOVA, relative to corresponding DMSO control. (H) Vero cells were primed with TG as indicated for 30 min, washed twice with PBS and infected with USSR virus 0.5 MOI. Viral RNA extraction was performed on culture media at 24 and 48 hpi followed by one-step reverse transcription qPCR to detect the relative copy number of M-gene RNA, based on relative Ct method. Vero cells are unable to produce type I IFNs, which appear necessary for TG to induce an antiviral state. Indicated significance based 2-way RM ANOVA relative to corresponding DMSO control. *** p < 0.001, **** p < 0.0001.
Figure 9
Figure 9
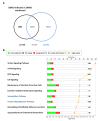
Differentially expressed genes exclusive to TG-primed and infected NHBE cells. NHBE cells were primed with 0.01 µM TG for 30 min, washed with PBS and infected with USSR H1N1 virus at 0.8 MOI for 12 h for RNA-seq followed by IPA analysis. (A) Differentially expressed genes (1862 transcripts) in NHBE cells in response to infection (based on filtering parameters of q < 0.05 and log2-fold-change < −1 and > +1) were identified as exclusive to TG-primed and infected NHBE cells (i.e., [TG-primed infected/TG-primed uninfected] less (DMSO infected/DMSO uninfected)). (B) Protein sumoylation and ubiquitination (highlighted blue) were among the enriched canonical pathways represented in the 1862 transcripts (based on filtering parameters of q < 0.05 and log2-fold-change < −1 and > +1) exclusive to TG-primed and infected NHBE cells. The stacked bar chart displays the percentage of significant differentially expressed genes that are upregulated (red) or downregulated (green) in each canonical pathway. The number of genes within the pathway recognised by IPA indicated by the numbers to the right of the bars. Orange line represents the −log p-value, indicating the statistical significance of the over-represented canonical pathway.

Similar articles

Cited by

References

    1. Goldhill D.H., Velthuis A.J.W.T., Fletcher R.A., Langat P., Zambon M., Lackenby A., Barclay W.S. The mechanism of resistance to favipiravir in influenza. Proc. Natl. Acad. Sci. USA. 2018;115:11613–11618. doi: 10.1073/pnas.1811345115. - DOI - PMC - PubMed
    1. Takashita E., Kawakami C., Ogawa R., Morita H., Fujisaki S., Shirakura M., Miura H., Nakamura K., Kishida N., Kuwahara T., et al. Influenza A(H3N2) virus exhibiting reduced susceptibility to baloxavir due to a polymerase acidic subunit I38T substitution detected from a hospitalised child without prior baloxavir treatment, Japan, January 2019. Eurosurveillance. 2019;24:1900170. doi: 10.2807/1560-7917.ES.2019.24.12.1900170. - DOI - PMC - PubMed
    1. Yong H.Y., Luo D. RIG-I-Like Receptors as Novel _targets for Pan-Antivirals and Vaccine Adjuvants Against Emerging and Re-Emerging Viral Infections. Front. Immunol. 2018;9:1379. doi: 10.3389/fimmu.2018.01379. - DOI - PMC - PubMed
    1. Ullah H., Hou W., Dakshanamurthy S., Tang Q. Host _targeted antiviral (HTA): Functional inhibitor compounds of scaffold protein RACK1 inhibit herpes simplex virus proliferation. Onco_target. 2019;10:3209–3226. doi: 10.18632/onco_target.26907. - DOI - PMC - PubMed
    1. Warfield K.L., Schaaf K.R., Dewald L.E., Spurgers K.B., Wang W., Stavale E., Mendenhall M., Shilts M.H., Stockwell T.B., Barnard D.L., et al. Lack of selective resistance of influenza A virus in presence of host-_targeted antiviral, UV-4B. Sci. Rep. 2019;9:7484. doi: 10.1038/s41598-019-43030-y. - DOI - PMC - PubMed

Publication types

MeSH terms

LinkOut - more resources

  NODES
admin 1
twitter 2