. 2020 Nov 2;130(11):5875-5892.
doi: 10.1172/JCI134132.

Orally bioavailable CDK9/2 inhibitor shows mechanism-based therapeutic potential in MYCN-driven neuroblastoma

Affiliations

Orally bioavailable CDK9/2 inhibitor shows mechanism-based therapeutic potential in MYCN-driven neuroblastoma

Evon Poon et al. J Clin Invest. .

Abstract

The undruggable nature of oncogenic Myc transcription factors poses a therapeutic challenge in neuroblastoma, a pediatric cancer in which MYCN amplification is strongly associated with unfavorable outcome. Here, we show that CYC065 (fadraciclib), a clinical inhibitor of CDK9 and CDK2, selectively _targeted MYCN-amplified neuroblastoma via multiple mechanisms. CDK9 - a component of the transcription elongation complex P-TEFb - bound to the MYCN-amplicon superenhancer, and its inhibition resulted in selective loss of nascent MYCN transcription. MYCN loss led to growth arrest, sensitizing cells for apoptosis following CDK2 inhibition. In MYCN-amplified neuroblastoma, MYCN invaded active enhancers, driving a transcriptionally encoded adrenergic gene expression program that was selectively reversed by CYC065. MYCN overexpression in mesenchymal neuroblastoma was sufficient to induce adrenergic identity and sensitize cells to CYC065. CYC065, used together with temozolomide, a reference therapy for relapsed neuroblastoma, caused long-term suppression of neuroblastoma growth in vivo, highlighting the clinical potential of CDK9/2 inhibition in the treatment of MYCN-amplified neuroblastoma.

Keywords: Cancer; Oncology; Transcription; Translation.


Conflict of interest statement

Conflict of interest: EP, YJ, CK, KB, A Hallsworth, G Box, MPL, GL, BMC, MV, ADHB, HW, GSA, RC, G Barone, AF, JB, PAC, JDB, SPR, SAE, PW, IV, and LC are employees of the ICR, which has a Rewards to Inventors scheme and has a commercial interest in the development of inhibitors of CDKs, with intellectual property licensed to and research funding provided by Merck and Cyclacel Pharmaceuticals. CYL has equity in and intellectual property licensed to Syros Pharmaceuticals. CYL is the vice president, Biology, and a shareholder of, and TL is a research scientist at and a shareholder of Kronos Bio Inc. PW is or has been a consultant/scientific advisory board member for Cyclacel, Astex Pharmaceuticals, CV6 Therapeutics, Nuevolution, Black Diamond Therapeutics, and Nextechinvest; received grant funding from Cyclacel; is a non-executive director of Storm Therapeutics; and holds equity in Chroma Therapeutics, Nextech, Black Diamond Therapeutics, and Storm. DZ is an employee of Cyclacel. JB holds equity in Neophore Ltd. and in Azeria Therapeutics.

Figures

Figure 1
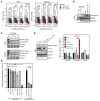
Figure 1. CDK9 and CDK2 are selectively essential for MYCN-amplified NB.
(A) GI50 of CCT68127 and CYC065 in a panel of NB cells. Cells were treated for 8 hours, washed off, and replaced with normal growth medium. GI50 values (μM) were calculated after 72 hours (n = 3). Significance was calculated using 2-tailed, unpaired Student’s t test. (B) Kelly cells were treated with CYC065 or CCT68127 for 0.5 to 6 hours (1 μM). Immunoblots illustrate expression of PARP cleavage (n = 2). (C) Immunoblots showing expression of p-RNAPII-Ser2 and p-RNAPII-Ser5, MYCN, and MCL-1 at the indicated times after treatment with CYC065 (1–2 μM, 1–8 hours) in Kelly cells (n = 2). (D) Flow cytometry analysis showing sub-G1 level of MYCN-amplified (Kelly, BE(2)C) and nonamplified (SH-EP, SK-N-AS) cells in response to CYC065 (1 μM; 8 hours). Data are represented as mean ± SD of 3 independent experiments. (E) Kelly cells were treated with CYC065 or CCT68127 at the indicated concentrations (0.5–2 μM) for 6 hours. Immunoblots depict expression of cleaved caspase-3 (n = 2).
Figure 2
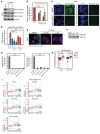
Figure 2. CDK9 and CDK2 synergistically maintain MYCN-amplified NB cells.
(A) CDK2 activity is obtained by measuring the cytoplasmic-to-nuclear ratio of DHB-mVenus. Cell nuclei were identified using DAPI staining. Bold lines represent median, boxes represent the interquartile range (IQR), whiskers represent 1.5 times the interquartile range, and outliers are not shown. Welch’s 2-tailed t test with Benjamini and Hochberg correction for multiple comparison. ***P < 1 × 10⁻⁸. (B) Kelly cells were treated with CYC065 or DMSO and harvested after 1 hour. CDK2 complexes were immunoprecipitated from cell lysates followed by an in vitro kinase assay using histone H1 as a substrate (n = 2). (C) Kelly and BE(2)C cells were treated with CYC065 for the indicated concentrations (0.5–2 μM) for 8 hours. Immunoblots show expression of the Rb protein (n = 2). (D) Immunoblots and bar plots showing expression of MYCN and cleaved PARP when cells were treated with compound 3 (Cmpd 3) at 1 × GI50 and/or siRNA directed to CDK2. Data are represented as mean ± SD of 2 independent experiments. Two-tailed, unpaired Student’s t test with Benjamini and Hochberg correction for multiple comparisons. ***P < 0.001. (E) Proliferation of NB cells quantified using a CellTiter-Glo assay. Kelly cells with CRISPR Cas9–mediated knockout of CDK2 (KO) or endogenous (WT) CDK2 were treated with CYC065 (8 hours), Deg (THAL-SNS-032, 8 hours), and siRNA against CDK9 or CDK2 for 48 hours. Data are represented as mean ± SD of 3 independent experiments. Two-tailed, unpaired Student’s t test with Benjamini and Hochberg correction for multiple comparisons. *P < 0.05; ***P < 0.001.
Figure 3
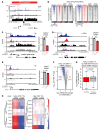
Figure 3. Inhibition of CDK9 blocks transcription of MYCN and genes with short half-lives.
(A and B) Immunoblot and graph showing effects of treatment with CYC065 (6 hours) on phosphorylation of RNAPII at Ser2 and Ser5 at the indicated concentrations in Kelly cells. Data are represented as mean ± SD of 3 independent experiments. Two-tailed, unpaired Student’s t test with Benjamini and Hochberg correction for multiple comparisons. ***P < 0.001. (C and D) Click-IT assay showing effect of CYC065 or CCT68127 (0.25–1 μM, 1 hours) on the abundance of newly synthesized nascent RNA in Kelly cells as illustrated in green fluorescence (C) and graph. Scale bar: 10 μm. (D). Data are represented as mean ± SD of 4 independent experiments. Two-tailed, unpaired Student’s t test with Benjamini and Hochberg correction for multiple comparisons ***P < 0.001. Scale bar: 10 μm. (E) Immunofluorescence showing newly synthesized nascent RNA (green) as described in C and FISH of MYCN gene– (red) and DAPI-stained nucleus (blue) following 1 hour treatment with CYC065 in Kelly cells (n = 3). (F) Immunoblot showing level of H3K27ac after treatment with CYC065 (1 μM) for 1 hour and 6 hours (n = 1). (G) 1PCR analyses showing levels of MYCN and MCL-1 genes extracted from fluorescently labeled nascent RNA in Figure 3C. Data are represented as mean ± SD of 4 independent experiments. Two-tailed, unpaired Student’s t test with Benjamini and Hochberg correction for multiple comparisons. ***P < 0.001. (H) Box plot documenting gene expression changes after CYC065 treatment (1 μM, 1 hour) of genes with short (<5 hours, n = 386) and long (>18 hours, n = 380) mRNA half-lives (58). Two-tailed, unpaired Wilcoxon’s rank sum test. (I) GSEA in MYCN-amplified (Kelly, BE(2)C), non–MYCN-amplified (SK-N-AS, SH-SY5Y) NB cell lines and tumors from TH-MYCN mice after treatment with CYC065. Shown is the MYC _target gene V2 gene set from the Hallmark collection of the MSigDB.
Figure 4
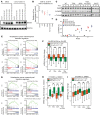
Figure 4. Pharmacologic blockade of CDK9 _targets MYCN-dependent transcriptional landscape.
(A) Gene tracks of chromatin accessibility (shown by ATAC-Seq, green), active chromatin marker: H3K27ac (blue) and CDK9 (black) occupancy at MYCN amplicon in Kelly cells. (B) Heatmaps of H3K27ac (blue), MYCN (red), and CDK9 (black) occupancy at all promoters (left) or enhancers (right) ranked by H3K27ac signal. Each row of heatmaps suggests 1 promoter region or enhancer region. The middle of heatmaps indicates the TSS or enhancer centers. (CE) Left: gene tracks of H3K27ac (blue), MYCN (red), and CDK9 (black) (±CYC065) occupancy at individual loci. ChIP-Seq occupancy is provided in units of rpm/bp. Canonical MYCN-binding sites (red lines) and noncanonical MYCN-binding sites (black lines) are indicated below gene tracks. Right: bar plots of corresponding gene expression normalized to control showing effect of CYC065 (1 μM; 1 hour) treatment. Data are represented as mean ± SD. Two-tailed Student’s t test. *P < 0.05; **P < 0.01. (F) Scatter plot of log2 gene expression (FPKM) fold changes (CYC065; 1 μM; 1 hour) treatment vs. DMSO control (x axis) versus significance of the change (y axis, –log10 FDR value). Genes with 1.5-fold or greater change in expression at an FDR of 0.1 or less are considered differentially expressed (blue and red). (G) The top 5000 transcriptionally active, expressed, and MYCN-associated genes are ranked by MYCN load (promoter + enhancer MYCN). Box plot implicating the log2 mRNA fold change of the top 1000 genes and the log2 mRNA fold change of the other 4000 genes. Two-tailed Student’s t test. (H) Heatmap indicating the mRNA log2 FPKM fold change from the FPKM median of TFs in adrenergic (Adren) and mesenchymal (Mes) core regulatory circuitries, with CYC065 (1 μM; 1 hour) treatment in Kelly cells.
Figure 5
Figure 5. CYC065 directly blocks MYCN-driven adrenergic cell identity.
(A) Immunoblots indicate stable MYCN expression in SH-EP MYCN system with CYC065 treatment (1 μM; 6 hours). (B) Potency against SH-EP and SH-EP MYCN cells in vitro. Cells are treated with 1 μM CYC065 for 8 hours followed by two PBS washes. Relative cell counts were calculated using CellTiter-Glo assays. Data are represented as mean ± SD of 3 independent experiments. (C) Immunoblots depict effect of 1 μM CYC065 treatment in SH-EP and SH-EP MYCN cells for 6 hours and 8 hours. (D) Dot plot showing quantification of PARP and cleaved PARP (Cl-PARP) in C. Data are represented as mean ± SD of 3 independent experiments. (E) GSEA in SH-EP and SH-EP MYCN cell lines. Anastassiou cancer mesenchymal transition signature is from the Hallmark collection of the Molecular Signatures Database. (F) Box plot showing SH-EP MYCN mRNA log2 fold change of adrenergic (ADRN) genes and mesenchymal (MES) genes compared with SH-EP cells. Bold lines represent median, boxes represent interquartile range, and whiskers represent 1.5 times the interquartile range. Outliers are not shown. Welch’s 2-tailed t test, Benjamini and Hochberg correction for multiple comparisons. ***P < 1 × 10⁻⁸. (G) GSEA in SH-EP and SH-EP MYCN cell lines after treatment with CYC065 (1 μM; 6 hours). (H) Box plot showing mRNA log2 fold change of TFs from median in adrenergic and mesenchymal core regulatory circuitries in SH-EP MYCN cells, which is caused by CYC065 (1 μM; 6 hours) treatments. Outliers are represented as dots. Welch’s 2-tailed t test and Benjamini and Hochberg correction for multiple comparisons. *P < 0.05. (I) Box plot showing CYC065 (1 μM; 6 hours) treatment and SH-EP MYCN mRNA log2 fold change of adrenergic genes and mesenchymal genes. Outliers are not shown. Welch’s 2-tailed t test, Benjamini and Hochberg correction for multiple comparisons. **P < 1 × 10⁻⁴.
Figure 6
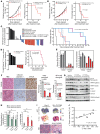
Figure 6. CYC065 and CCT68127 inhibit MYCN-driven NB in vivo.
Effects of CYC065 on the growth and survival of Kelly (MYCN amplified) (A) and SK-N-AS (nonamplified) (B) NB xenografts in mice. Data are expressed as mean ± SEM (log-rank Mantel-Cox test with a 5% level of significance). (C) Waterfall plot documenting relative changes in tumor volume at day 7 in the TH-MYCN GEM model. All treatment arms versus control: P < 0.001, 2-tailed, unpaired Student’s t test incorporating Bonferroni’s correction (n = 5) with a 1% level of significance. Kaplan-Meier plot documenting survival of TH-MYCN mice. All treatment arms versus control: P < 0.01; and CYC065 or CCT68127 alone versus combination with temozolomide: P = 0.02 (log-rank Mantel-Cox test with 5% level of significance. (D) Waterfall plot documenting relative changes in tumor volume at day 7 in the TH-ALKF1174L/MYCN GEM model: P < 0.001, 2-tailed unpaired Student’s t test with 5% level of significance. Kaplan-Meier plot documenting survival of TH-ALKF1174L/MYCN mice: P < 0.01, log-rank Mantel-Cox test with a 5% level of significance) (E) Quantitative RT-PCR analyses showing levels of murine and human MYCN RNA in the TH-ALKF1174L/MYCN tumor following treatment with CYC065 for 3 days (n = 3). (F) Representative images and quantitative analysis of H&E and immunohistochemical staining for cleaved capsase-3 and MYCN in the harvested tumors from A and B. Scale bar: 50 μm. (G and H) Immunoblot analyses of individual tumors from TH-MYCN model treated with CYC065 for 1 or 3 days. Data are represented as mean ± SD of 4 independent experiments. Two-tailed unpaired Student’s t test with Benjamini and Hochberg correction for multiple comparisons. *P < 0.05; **P < 0.01. (I) Parametric functional MRI maps showing reduction of tumor spin lattice relaxation time T1 and an increase in ADC 24 hours after treatment with 50 mg/kg CYC065, and their corresponding H&E staining. Scale bar: 100 μm. (J) Correlation between native tumor T1 measured 24 hours after treatment with 50 mg/kg CYC065 or CCT68127 (percentage of pretreatment value) and relative changes in tumor volume following treatment with 50 mg/kg CYC065 or CCT68127.

Similar articles

Cited by

References

    1. Dang CV, Reddy EP, Shokat KM, Soucek L. Drugging the ‘undruggable’ cancer _targets. Nat Rev Cancer. 2017;17(8):502–508. doi: 10.1038/nrc.2017.36. - DOI - PMC - PubMed
    1. Meyer N, Penn LZ. Reflecting on 25 years with MYC. Nat Rev Cancer. 2008;8(12):976–990. doi: 10.1038/nrc2231. - DOI - PubMed
    1. Soucek L, et al. Modelling Myc inhibition as a cancer therapy. Nature. 2008;455(7213):679–683. doi: 10.1038/nature07260. - DOI - PMC - PubMed
    1. Dang CV. MYC on the path to cancer. Cell. 2012;149(1):22–35. doi: 10.1016/j.cell.2012.03.003. - DOI - PMC - PubMed
    1. Poole CJ, van Riggelen J. MYC-master regulator of the cancer epigenome and transcriptome. Genes (Basel) 2017;8(5):142. - PMC - PubMed

Publication types

MeSH terms

  NODES
ELIZA 2
Experiments 9
HOME 2
iOS 1
Javascript 1
mac 15
os 37
text 13
twitter 2
web 6