Risk Factor Control and Cardiovascular Event Risk in People With Type 2 Diabetes in Primary and Secondary Prevention Settings
- PMID: 33196309
- PMCID: PMC7664968
- DOI: 10.1161/CIRCULATIONAHA.120.046783
Risk Factor Control and Cardiovascular Event Risk in People With Type 2 Diabetes in Primary and Secondary Prevention Settings
Abstract
Background: To examine the association between the degree of risk factor control and cardiovascular disease (CVD) risk in type 2 diabetes and to assess if the presence of cardio-renal disease modifies these relationships.
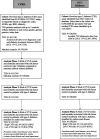
Methods: A retrospective cohort study using data from English practices from CPRD GOLD (Clinical Practice Research Datalink) and the SCI-Diabetes dataset (Scottish Care Information-Diabetes), with linkage to hospital and mortality data. We identified 101 749 with type 2 diabetes (T2D) in CPRD matched with 378 938 controls without diabetes and 330 892 with type 2 diabetes in SCI-Diabetes between 2006 and 2015. The main exposure was number of optimized risk factors: nonsmoker, total cholesterol ≤4 mmol/L, triglycerides ≤1.7 mmol/L, glycated haemoglobin (HbA1c) ≤53 mmol/mol (≤7.0%), systolic blood pressure <140mm Hg, or <130 mm Hg if high risk. Cox models were used to assess cardiovascular risk associated with levels of risk factor control.
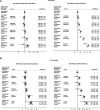
Results: In CPRD, the mean baseline age in T2D was 63 years and 28% had cardio-renal disease (SCI-Diabetes: 62 years; 35% cardio-renal disease). Over 3 years follow-up (SCI-Diabetes: 6 years), CVD events occurred among 27 900 (27%) CPRD-T2D, 101 362 (31%) SCI-Diabetes-T2D, and 75 520 (19%) CPRD-controls. In CPRD, compared with controls, T2D participants with optimal risk factor control (all risk factors controlled) had a higher risk of CVD events (adjusted hazard ratio, 1.21; 95% confidence interval, 1.12-1.29). In T2D participants from CPRD and SCI-Diabetes, pooled hazard ratios for CVD associated with 5 risk factors being elevated versus optimal risk factor control were 1.09 (95% confidence interval, 1.01-1.17) in people with cardio-renal disease but 1.96 (95% confidence interval, 1.82-2.12) in people without cardio-renal disease. People without cardio-renal disease were younger and more likely to have likely to have suboptimal risk factor control but had fewer prescriptions for risk factor modifying medications than those with cardio-renal disease.
Conclusions: Optimally managed people with T2D have a 21% higher CVD risk when compared with controls. People with T2D without cardio-renal disease would be predicted to benefit greatly from CVD risk factor intervention.
Keywords: cardiovascular risk factors; primary care; primary prevention; risk assessment; secondary care; secondary prevention; type 2 diabetes.
Figures


Similar articles
-
Skin autofluorescence predicts new cardiovascular disease and mortality in people with type 2 diabetes.BMC Endocr Disord. 2021 Jan 12;21(1):14. doi: 10.1186/s12902-020-00676-4. BMC Endocr Disord. 2021. PMID: 33435948 Free PMC article.
-
Hemoglobin a1c levels and the risk of cardiovascular disease in people without known diabetes: a population-based cohort study in Japan.Medicine (Baltimore). 2015 May;94(17):e785. doi: 10.1097/MD.0000000000000785. Medicine (Baltimore). 2015. PMID: 25929925 Free PMC article.
-
Associations between usual glycated haemoglobin and cardiovascular disease in patients with type 2 diabetes mellitus: A 10-year diabetes cohort study.Diabetes Obes Metab. 2020 Dec;22(12):2325-2334. doi: 10.1111/dom.14157. Epub 2020 Sep 17. Diabetes Obes Metab. 2020. PMID: 32744402
-
Dietary fibre for the primary prevention of cardiovascular disease.Cochrane Database Syst Rev. 2016 Jan 7;2016(1):CD011472. doi: 10.1002/14651858.CD011472.pub2. Cochrane Database Syst Rev. 2016. PMID: 26758499 Free PMC article. Review.
-
Multiple risk factor interventions for primary prevention of cardiovascular disease in low- and middle-income countries.Cochrane Database Syst Rev. 2015 Aug 4;2015(8):CD011163. doi: 10.1002/14651858.CD011163.pub2. Cochrane Database Syst Rev. 2015. PMID: 26272648 Free PMC article. Review.
Cited by
-
Validation of the WATCH-DM and TRS-HFDM Risk Scores to Predict the Risk of Incident Hospitalization for Heart Failure Among Adults With Type 2 Diabetes: A Multicohort Analysis.J Am Heart Assoc. 2022 Jun 7;11(11):e024094. doi: 10.1161/JAHA.121.024094. Epub 2022 Jun 3. J Am Heart Assoc. 2022. PMID: 35656988 Free PMC article.
-
Assessing the impact of type 2 diabetes on mortality and life expectancy according to the number of risk factor _targets achieved: an observational study.BMC Med. 2024 Mar 13;22(1):114. doi: 10.1186/s12916-024-03343-w. BMC Med. 2024. PMID: 38475845 Free PMC article.
-
To What Extent Does Cardiovascular Risk Classification of Patients with Type 2 Diabetes Differ between European Guidelines from 2023, 2021, and 2019? A Cross-Sectional Study.Medicina (Kaunas). 2024 Feb 16;60(2):334. doi: 10.3390/medicina60020334. Medicina (Kaunas). 2024. PMID: 38399621 Free PMC article.
-
Longitudinal changes in blood pressure and fasting plasma glucose among 5,398 primary care patients with concomitant hypertension and diabetes: An observational study and implications for community-based cardiovascular prevention.Front Cardiovasc Med. 2023 Apr 3;10:1120543. doi: 10.3389/fcvm.2023.1120543. eCollection 2023. Front Cardiovasc Med. 2023. PMID: 37077741 Free PMC article.
-
Risk factor control and incident cardiovascular disease in patients with diabetes: Sex-specific relations.Diabetes Obes Metab. 2024 Apr;26(4):1421-1429. doi: 10.1111/dom.15443. Epub 2024 Jan 16. Diabetes Obes Metab. 2024. PMID: 38229469
References
-
- Wright AK, Kontopantelis E, Emsley R, Buchan I, Sattar N, Rutter MK, Ashcroft DM. Life expectancy and cause-specific mortality in type 2 diabetes: a population-based cohort study quantifying relationships in ethnic subgroups. Diabetes Care. 2017;40:338–345. doi: 10.2337/dc16-1616 - PubMed
-
- Wright AK, Kontopantelis E, Emsley R, Buchan I, Mamas MA, Sattar N, Ashcroft DM, Rutter MK. Cardiovascular risk and risk factor management in type 2 diabetes mellitus. Circulation. 2019;139:2742–2753. doi: 10.1161/CIRCULATIONAHA.118.039100 - PubMed
-
- Gaede P, Vedel P, Larsen N, Jensen GV, Parving HH, Pedersen O. Multifactorial intervention and cardiovascular disease in patients with type 2 diabetes. N Engl J Med. 2003;348:383–393. doi: 10.1056/NEJMoa021778 - PubMed
-
- Gaede P, Lund-Andersen H, Parving HH, Pedersen O. Effect of a multifactorial intervention on mortality in type 2 diabetes. N Engl J Med. 2008;358:580–591. doi: 10.1056/NEJMoa0706245 - PubMed
-
- Gæde P, Oellgaard J, Carstensen B, Rossing P, Lund-Andersen H, Parving HH, Pedersen O. Years of life gained by multifactorial intervention in patients with type 2 diabetes mellitus and microalbuminuria: 21 years follow-up on the Steno-2 randomised trial. Diabetologia. 2016;59:2298–2307. doi: 10.1007/s00125-016-4065-6 - PMC - PubMed
Publication types
MeSH terms
Substances
Grants and funding
LinkOut - more resources
Full Text Sources
Medical

