. 2020 Oct 10;11(4):661-694.
doi: 10.1007/s13167-020-00224-z. eCollection 2020 Dec.

Quantitative proteomics revealed energy metabolism pathway alterations in human epithelial ovarian carcinoma and their regulation by the antiparasite drug ivermectin: data interpretation in the context of 3P medicine

Affiliations

Quantitative proteomics revealed energy metabolism pathway alterations in human epithelial ovarian carcinoma and their regulation by the antiparasite drug ivermectin: data interpretation in the context of 3P medicine

Na Li et al. EPMA J. .

Abstract

Objective: Energy metabolism abnormality is the hallmark in epithelial ovarian carcinoma (EOC). This study aimed to investigate energy metabolism pathway alterations and their regulation by the antiparasite drug ivermectin in EOC for the discovery of energy metabolism pathway-based molecular biomarker pattern and therapeutic _targets in the context of predictive, preventive, and personalized medicine (PPPM) in EOC.

Methods: iTRAQ-based quantitative proteomics was used to identify mitochondrial differentially expressed proteins (mtDEPs) between human EOC and control mitochondrial samples isolated from 8 EOC and 11 control ovary tissues from gynecologic surgery of Chinese patients, respectively. Stable isotope labeling with amino acids in cell culture (SILAC)-based quantitative proteomics was used to analyze the protein expressions of energy metabolic pathways in EOC cells treated with and without ivermectin. Cell proliferation, cell cycle, apoptosis, and important molecules in energy metabolism pathway were examined before and after ivermectin treatment of different EOC cells.

Results: In total, 1198 mtDEPs were identified, and various mtDEPs were related to energy metabolism changes in EOC, with an interesting result that EOC tissues had enhanced abilities in oxidative phosphorylation (OXPHOS), Kreb's cycle, and aerobic glycolysis, for ATP generation, with experiment-confirmed upregulations of UQCRH in OXPHOS; IDH2, CS, and OGDHL in Kreb's cycle; and PKM2 in glycolysis pathways. Importantly, PDHB that links glycolysis with Kreb's cycle was upregulated in EOC. SILAC-based quantitative proteomics found that the protein expression levels of energy metabolic pathways were regulated by ivermectin in EOC cells. Furthermore, ivermectin demonstrated its strong abilities to inhibit proliferation and cell cycle and promote apoptosis in EOC cells, through molecular networks to _target PFKP in glycolysis; IDH2 and IDH3B in Kreb's cycle; ND2, ND5, CYTB, and UQCRH in OXPHOS; and MCT1 and MCT4 in lactate shuttle to inhibit EOC growth.

Conclusions: Our findings revealed that the Warburg and reverse Warburg effects coexisted in human ovarian cancer tissues, provided the first multiomics-based molecular alteration spectrum of ovarian cancer energy metabolism pathways (aerobic glycolysis, Kreb's cycle, oxidative phosphorylation, and lactate shuttle), and demonstrated that the antiparasite drug ivermectin effectively regulated these changed molecules in energy metabolism pathways and had strong capability to inhibit cell proliferation and cell cycle progression and promote cell apoptosis in ovarian cancer cells. The observed molecular changes in energy metabolism pathways bring benefits for an in-depth understanding of the molecular mechanisms of energy metabolism heterogeneity and the discovery of effective biomarkers for individualized patient stratification and predictive/prognostic assessment and therapeutic _targets/drugs for personalized therapy of ovarian cancer patients.

Keywords: Aerobic glycolysis; Early diagnosis; Energy metabolism pathway; Epithelial ovarian carcinoma; Ivermectin; Kreb’s cycle; Lactate shuttle; Mitochondrial proteomics; Molecular biomarker pattern; Oxidative phosphorylation; Predictive preventive personalized medicine (PPPM); Prognostic assessment; Reverse Warburg effect; SILAC-based quantitative proteomics; Warburg effect; iTRAQ-based quantitative proteomics.


Conflict of interest statement

Competing interestsThe authors declare that they have no competing interests.

Figures

Fig. 1
Fig. 1
Identification of mitochondrial differentially expressed proteins in EOCs relative to controls. a Experimental flowchart to study mitochondrial differentially expressed proteins. b Electron micrograph analysis of mitochondria isolated from epithelial ovarian cancer (A) and control (B) tissues. c Organelle-specific antibody-based western blot analysis of mitochondria isolated from epithelial ovarian cancer (A) and control (B) tissues. Equal amounts of proteins were loaded onto a 10% SDS-PAGE and analyzed by western blotting with indicated antibodies against marker proteins from the cell nucleus, cytomembrane, mitochondrion, Golgi apparatus, peroxisomes, and lysosome. d Distribution status of 1198 mtDEPs according to their molecular mass (Mr). e Distribution status of 1198 mtDEPs according to their isoelectric points (pI). EOC, epithelial ovarian carcinoma; SDS-PAGE, sodium dodecyl sulfate polyacrylamide gel electrophoresis; mtDEPs, mitochondrial differentially expressed proteins; iTRAQ, isobaric tags for relative and absolute quantitation; LC-MS/MS, liquid chromatography-tandem mass spectrometry; GO, Gene Ontology; GM130, golgin A2; KEGG, Kyoto Encyclopedia of Genes and Genomes; COX4I1, cytochrome c oxidase subunit 4I1
Fig. 2
Fig. 2
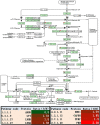
Glycolysis/gluconeogenesis pathway altered in epithelial ovarian cancer. Green rectangle with red mark means the differentially expressed proteins. Green rectangle without red mark means species-specific enzymes. White rectangle means reference pathway. The solid line means molecular interaction. The dot line means indirect effect. The circle means mostly chemical complex. ADH5, alcohol dehydrogenase 5 class III chi polypeptide; GPI, glucose-6-phosphate isomerase; LDHB, lactate dehydrogenase B; LDHA, lactate dehydrogenase A; ENO1, enolase 1; GAPDH, glyceraldehyde-3-phosphate dehydrogenase; PFKP, phosphofructokinase, platelet; PKM, pyruvate kinase muscle
Fig. 3
Fig. 3
Kreb’s cycle altered in ovarian cancer. Green rectangle without red mark means species-specific enzymes. White rectangle means reference pathway. The solid line means molecular interaction. The dot line means indirect effect. The circle means mostly chemical complex. ACO1, cytoplasmic aconitate hydratase; PDHB, pyruvate dehydrogenase E1 subunit beta; IDH2, isocitrate dehydrogenase (NADP(+)) 2; CS, citrate synthase; IDH3A, mitochondrial isocitrate dehydrogenase [NAD] subunit alpha; FH, fumarate hydratase; MDH2, malate dehydrogenase 2; SUCLG2, succinate–CoA ligase GDP-forming subunit beta; IDH3B, isocitrate dehydrogenase (NAD(+)) 3 noncatalytic subunit beta; OGDHL, oxoglutarate dehydrogenase L; PCK2, mitochondrial phosphoenolpyruvate carboxykinase [GTP]
Fig. 4
Fig. 4
Oxidative phosphorylation altered in ovarian cancer. Green rectangle with red mark means the differential proteins. Green rectangle without red mark means species-specific enzymes. White rectangle means reference pathway. The solid line means molecular interaction. The dot line means indirect effect. The circle means mostly chemical complex. COX4I2, cytochrome c oxidase subunit 4I2; ND2, mitochondrially encoded NADH dehydrogenase 2; ND5, mitochondrially encoded NADH dehydrogenase 5; COX17, cytochrome c oxidase copper chaperone COX17; COX6C, cytochrome c oxidase subunit 6C; ATP6V1D, ATPase H+ transporting V1 subunit D; COX7A2, cytochrome c oxidase subunit 7A2; ATP5G1, ATP synthase membrane subunit c locus 1; QCR6, mitochondrial cytochrome b-c1 complex subunit 6; ATP6V0C, ATPase H+ transporting V0 subunit c; COX2, cytochrome c oxidase subunit II; CYTB, mitochondrially encoded cytochrome b; CYP3A4, cytochrome P450 family 3 subfamily A member 4; COX1, cytochrome c oxidase subunit; ATP6, ATP synthase F0 subunit 6; COX7A2L, cytochrome c oxidase subunit 7A2 like; COX4I1, cytochrome c oxidase subunit 4I1
Fig. 5
Fig. 5
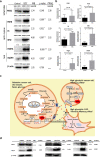
Western blot analysis to validate results of iTRAQ labeling. a, b Mitochondrial proteins of EOC and control tissues were analyzed by WB using antibodies against PKM2, PDHB, CS, IDH2, OGDHL, and UQCRH. The levels of PKM2, PDHB, CS, IDH2, OGDHL, and UQCRH were normalized relative to β-actin. Data represent mean values ± SD. c Warburg effect and the reverse Warburg effect. Parenchymal cells showed metabolic heterogeneity. Some cancer cells were high glycolytic cancer cell consisting with “Warburg effect,” and the other cancer cells were oxidative cancer cell consisting with “the reverse Warburg effect.” Tumor cells and stroma cells (especially CAFs) have metabolic symbiosis; thus, cancer cell induced oxidative stress of CAFs by secreting ROS and enhanced aerobic glycolysis in CAFs. In turn, CAFs produced lots of nourishment, which was “eaten” up by the cancer cells to produce ATP. *p < 0.05, **p < 0.01, ***p < 0.001. iTRAQ, isobaric tags for relative and absolute quantitation; EOC, epithelial ovarian carcinoma; WB, western blot; ROS, reactive oxygen species; PKM2, pyruvate kinase M2; PDHB, pyruvate dehydrogenase E1 subunit beta; CS, citrate synthase; IDH2, isocitrate dehydrogenase (NADP(+)) 2; OGDHL, oxoglutarate dehydrogenase L; UQCRH, ubiquinol-cytochrome c reductase hinge protein; CAFs, cancer-associated fibroblasts; PDK, pyruvate dehydrogenase (acetyl-transferring)] kinase; MCT1, solute carrier family 16 member 1; MCT4, solute carrier family 16 member 4
Fig. 6
Fig. 6
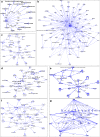
IPA analysis revealed that ivermectin was associated with production of ROS and energy metabolism. a Disease and function analysis of ivermectin based on IPA software. b Biomolecular networks analysis of ivermectin based on IPA software showed that ivermectin regulated PKM. c Biomolecular networks analysis of ivermectin based on IPA software showed that ivermectin regulated OGDHL. d Biomolecular networks analysis of ivermectin based on IPA software showed that ivermectin regulated ND2. e Biomolecular networks analysis of ivermectin based on IPA software showed that ivermectin regulated ND5. f Biomolecular networks analysis of ivermectin based on IPA software showed that ivermectin regulated UQCRH. IPA, Ingenuity Pathway Analysis; ROS, reactive oxygen species; PKM, pyruvate kinase muscle; OGDHL, oxoglutarate dehydrogenase L; ND2, mitochondrially encoded NADH dehydrogenase 2; ND5, mitochondrially encoded NADH dehydrogenase 5; UQCRH, ubiquinol-cytochrome c reductase hinge protein
Fig. 7
Fig. 7
Ivermectin inhibited ovarian cancer cells proliferation in vitro. a Cell viability was measured by the CCK8 assay in IOSE80, SKOV3, and TOV-21G cells treated with the different concentrations of ivermectin for 24 h (n = 3, X = Log (ivermectin concentration)). b CCK8 cell proliferation test on SKOV3 (n = 3). c CCK8 cell proliferation test on TOV-21G (n = 3). d EdU cell proliferation test on SKOV3. e EdU cell proliferation test on TOV-21G. f Histogram statistics of EdU cell proliferation test on SKOV3 and TOV-21G (n = 3). g Clonogenic survival test on SKOV3 and TOV-21G. h Histogram statistics of clonogenic survival test on SKOV3 and TOV-21G (n = 3). *p < 0.05, **p < 0.01, ***p < 0.001
Fig. 8
Fig. 8
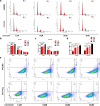
Ivermectin inhibits cell cycle progression and promotes EOC cell apoptosis. a Differences in cell cycle distributions following ivermectin at multiple drug concentrations (0 μM, 10 μM, 20 μM, and 30 μM) by fluorescence-activated cell sorting (FACS). b Histogram statistics of cell cycle distributions on SKOV3 (n = 3). c Histogram statistics of cell cycle distributions on TOV-21G (n = 3). d Histogram statistics of apoptosis cell percentage on SKOV3 and TOV-21G (n = 3). e Apoptosis cell percentage following ivermectin at multiple drug concentrations (0 μM, 10 μM, 20 μM, and 30 μM) by fluorescence-activated cell sorting (FACS). *p < 0.05, **p < 0.01, ***p < 0.001. EOC, epithelial ovarian carcinoma
Fig. 9
Fig. 9
Ivermectin affects energy metabolism for its anticancer efficiency through _targeting PFKP, IDH2, IDH3B, ND2, ND5, CYTB, UQCRH, MCT1, and MCT4 at the mRNA levels analyzed with qPCR. af EOC cells adding ivermectin (10 μM, 20 μM, and 30 μM) and control cell lines (within 0.1% DMSO) were verified by RT-PCR after treatment to identify energy metabolism enzymes and lactate shuttle (MCT1 and MCT2) mRNA expressions (n = 3). *p < 0.05, **p < 0.01, ***p < 0.001. PFKP, phosphofructokinase platelet; IDH2, isocitrate dehydrogenase (NADP(+)) 2; IDH3B, isocitrate dehydrogenase (NAD(+)) 3 noncatalytic subunit beta; ND2, mitochondrially encoded NADH dehydrogenase 2; ND5, mitochondrially encoded NADH dehydrogenase 5; UQCRH, ubiquinol-cytochrome c reductase hinge protein; MCT1, solute carrier family 16 member 1; MCT4, solute carrier family 16 member 4; EOC, epithelial ovarian carcinoma; CYTB, mitochondrially encoded cytochrome b; DMSO, dimethyl sulfoxide; qRT-PCR, quantitative real-time PCR
Fig. 10
Fig. 10
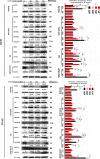
Ivermectin affects energy metabolism for its anticancer efficiency through _targeting PFKP, IDH2, IDH3B, ND2, ND5, CYTB, UQCRH, MCT1, and MCT4 at the protein levels analyzed with western blot. EOC cells adding ivermectin (10 μM, 20 μM, and 30 μM) and control cell lines (within 0.1% DMSO) were verified by western blot to detect the protein expression of FPKP, PKM, PDHB,CS, IDH2, IDH3A, IDH3B, OGDHL, ND2, ND5, CYTB, UQCRH, MCT1, and MCT4 (n = 3). *p < 0.05, **p < 0.01, ***p < 0.001. PFK, phosphofructokinase platelet; IDH2, isocitrate dehydrogenase (NADP(+)) 2, IDH3A, mitochondrial isocitrate dehydrogenase [NAD] subunit alpha; IDH3B, isocitrate dehydrogenase (NAD(+)) 3 noncatalytic subunit beta; ND2, mitochondrially encoded NADH dehydrogenase 2; ND5, mitochondrially encoded NADH dehydrogenase 5; UQCRH:, ubiquinol-cytochrome c reductase hinge protein; MCT1, solute carrier family 16 member 1; MCT4, solute carrier family 16 member 4; EOC, epithelial ovarian carcinoma; CYTB, mitochondrially encoded cytochrome b; DMSO, dimethyl sulfoxide; PKM, pyruvate kinase muscle; PDHB, pyruvate dehydrogenase E1 subunit beta; CS, citrate synthase; OGDHL, oxoglutarate dehydrogenase L

Similar articles

Cited by

References

    1. Chan JK, Cheung MK, Husain A, Teng NN, West D, Whittemore AS, Berek JS, Osann K. Patterns and progress in ovarian cancer over 14 years. Obstet Gynecol. 2006;108:521–528. doi: 10.1097/01.AOG.0000231680.58221.a7. - DOI - PubMed
    1. Siegel RL, Miller KD, Jemal A. Cancer statistics, 2016. CA Cancer J Clin. 2016;66:7–30. doi: 10.3322/caac.21332. - DOI - PubMed
    1. Gadducci A, Cosio S, Zola P, Landoni F, Maggino T, Sartori E. Surveillance procedures for patients treated for epithelial ovarian cancer: a review of the literature. Int J Gynecol Cancer. 2007;17:21–31. doi: 10.1111/j.1525-1438.2007.00826.x. - DOI - PubMed
    1. Smith RA, Manassaram-Baptiste D, Brooks D, Doroshenk M, Fedewa S, Saslow D, Brawley OW, Wender R. Cancer screening in the United States, 2015: a review of current American Cancer Society guidelines and current issues in cancer screening. CA Cancer J Clin. 2015;65:30–54. doi: 10.3322/caac.21261. - DOI - PubMed
    1. Buchtel KM, Vogel Postula KJ, Weiss S, Williams C, Pineda M, Weissman SM. FDA approval of PARP inhibitors and the impact on genetic counseling and genetic testing practices. J Genet Couns. 2018;27(1):131–139. doi: 10.1007/s10897-017-0130-7. - DOI - PubMed

LinkOut - more resources

  NODES
Association 1
twitter 2