. 2021 Jan 6;14(1):2.
doi: 10.1186/s13072-020-00377-1.

Chromatin accessibility maps provide evidence of multilineage gene priming in hematopoietic stem cells

Affiliations

Chromatin accessibility maps provide evidence of multilineage gene priming in hematopoietic stem cells

Eric W Martin et al. Epigenetics Chromatin. .

Abstract

Hematopoietic stem cells (HSCs) have the capacity to differentiate into vastly different types of mature blood cells. The epigenetic mechanisms regulating the multilineage ability, or multipotency, of HSCs are not well understood. To test the hypothesis that cis-regulatory elements that control fate decisions for all lineages are primed in HSCs, we used ATAC-seq to compare chromatin accessibility of HSCs with five unipotent cell types. We observed the highest similarity in accessibility profiles between megakaryocyte progenitors and HSCs, whereas B cells had the greatest number of regions with de novo gain in accessibility during differentiation. Despite these differences, we identified cis-regulatory elements from all lineages that displayed epigenetic priming in HSCs. These findings provide new insights into the regulation of stem cell multipotency, as well as a resource to identify functional drivers of lineage fate.


Conflict of interest statement

The authors declare that they have no competing interests.

Figures
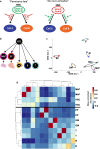
Fig. 1
Fig. 1
ATAC-seq maps of hematopoietic cell populations exhibit a high degree of reproducibility between replicates and a tight association of MkPs to HSCs. a Two models of epigenetic regulation of HSC fate. In the “permissive fate” model, CREs of lineage-specific genes of all possible lineage outcomes are in an accessible state (green) in HSCs, keeping genes “primed” for subsequent activation. After lineage commitment occurs towards one fate, the accessibility of primed elements of the alternative fate is restricted by epigenetic remodeling (red). In contrast, the “de novo activation” model posits that CREs of lineage-specific genes are in an inaccessible state (red) in HSCs, keeping genes silenced. Lineage commitment occurs by de novo decondensing of chromatin at the appropriate CRE, allowing for subsequent activation of the differentiation program (green). The CREs of alternative lineage fates remain epigenetically repressed (red). b Schematic diagram of the hematopoietic cells used in this study. Six cell populations were investigated: multipotent HSCs (Hematopoietic stem cells), unilineage MkPs (megakaryocyte progenitors) and EPs (erythroid progenitors), and mature GMs (Granulocyte/Macrophages), B cells, and T cells. c tSNE analysis of the ATAC-seq peaks revealed a high concordance of biological replicates. MkPs clustered close to HSCs, while EPs, GMs, B, and T cells separated across the tSNE plot. d Hierarchical clustering revealed high concordance of cell type-specific replicates. Similar to the tSNE analysis, MkPs clustered closest to HSCs. B and T cells were closely associated to each other but distant to HSCs, while GMs and EPs were contained within their own branches, closer to HSCs
Fig. 2
Fig. 2
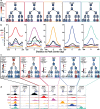
Promoter accessibility correlated with known expression patterns of cell type-specific genes. a Lineage-specific gene expression patterns used to find all genes expressed within each unipotent lineage cell type. The level of expression (red = high; blue = low/not expressed) according to the Gene Expression Commons (GEXC) database. b Lineage-specific promoters had accessibility of the corresponding unipotent lineage cell types. Homer histograms of the average cumulative signal of all cell types used in this study across the lineage-specific promoter gene lists for EPs, MkPs, GMs, B cells, and T cells. c Lineage-specific expression of one example gene each for MkPs, EPs, B, or T cells. The level of expression (red = high; blue = low/not expressed) according to the Gene Expression Commons (GEXC) database of an example gene with cell type-specific ATAC-seq promoter peak. The probeset for the GM-specific Ly6g is not present in GEXC and therefore not displayed. d Cell type-specific chromatin accessibility visualized as ATAC-seq read-counts at transcription start sites (TSS) using UCSC Genome Browser snapshots. Depiction of the six ATAC-seq libraries used in this study with example genes that had ATAC-seq signal in all samples (GAPDH; positive control), no samples (Fezf2; negative control), or in a specific cell type: HSCs (Ndn), EPs (Klf1), MkPs (Gp6), GMs (Ly6g), B cells (CD19), and T cells (Ccr4)
Fig. 3
Fig. 3
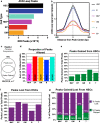
Greater overall global accessibility of HSCs and more extensive chromatin remodeling upon lymphoid differentiation. a HSCs had the highest number of peaks of all hematopoietic cell types. The total number of individual peaks are displayed for each cell type. HSCs had the highest number of peaks followed by B cells, T cells, MkPs, EPs, then GM cells. b HSCs had the highest total accessibility signal across all peaks of all hematopoietic cell types analyzed. Average cumulative signal across the master peak-list (the number of sequencing reads that fall into the detected peaks) was determined by the -hist function of HOMER annotatePeaks.pl. c–g Comparisons of the number of peaks gained and lost upon HSC differentiation into unipotent cells revealed that MkPs had the most similar accessibility profile to HSCs. c Schematic of the pairwise comparisons made. HSC peaks were compared with one unilineage cell type at a time and those comparisons are reported in dg. d MkPs had the lowest percentage of altered peaks from HSCs compared to the other 4 unilineage cell types. The percentage of all non-overlapping peaks (peaks both gained and lost) calculated as the ratio of unique peaks in each cell type when compared pairwise to HSCs divided by the total number of peaks called in that cell type are displayed here. The numbers in the bars represent the total number of peaks altered (gained + lost) for each cell type. EPs had the highest percentage of peaks altered (gained + lost), followed by T cells, GMs, then B cells. e B cells had the highest percentage of peaks gained from HSCs, while MkPs had the lowest. Calculations as in d, but only peaks gained are shown. f EPs had the highest percentage of peaks lost from HSCs, while B cells had the least. Calculations as in d, but only peaks lost are shown. g B cells were the only lineage with more peaks gained (53%) than lost (47%) upon differentiation from HSCs. In this panel, the sum of peaks gained and lost in each cell type was set to 100% and then the ratio of peaks gained and lost was displayed. T cells had the second highest proportion of peaks gained (27%), followed by MkPs (19%), EPs (16%), then GMs (15%)
Fig. 4
Fig. 4
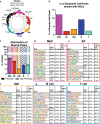
Peaks shared between HSCs and unipotent cell types are primarily non-promoter and are enriched for known cell type-specific transcription factors. a Schematic for how the unipotent lineage peaks exclusively intersected with HSC peaks were generated. Peaks were compared using HOMER mergePeaks.pl tool using peak-lists from the 6 cell types assayed. The resulting 5 overlapping peak-lists contained shared peaks between HSCs and only the unipotent cell type of interest (but not present in any of the other four lineages). The five exclusive pairwise comparisons (e.g., HSC/MkP only, HSC/EP, etc.) were used for panels b–h. b MkPs have the highest peak overlap with HSCs. The number of unipotent lineage peaks that were uniquely intersected with HSCs was divided by the total number of peaks for each mature cell type. MkPs had the highest percentage of HSC overlap (12.2%), followed by B cells (9.2%), GMs (3.4%), T cells (2.4%), then EPs (2.2%). c Peaks exclusively shared between each unipotent cell type and HSCs were significantly enriched in the non-promoter regions of the genome. The shared peak-lists described in a were annotated using HOMER annotatePeaks.pl function and filtered as promoter (± 500 bp from TSS), and non-promoter (< -500 bp and >  + 500 bp from TSS). The number of promoter and non-promoter peaks was divided by the total number of peaks for each cell type. For all cell types, less than 20% of peaks were promoter peaks, with MkPs with the highest (16.4%) and GMs with the lowest (5.3%) percentage. This is a significant (< 0.001) difference compared to the normal distribution of promoter peaks (35–61%) for each cell type assayed. ***p-value of < .001. d–h Unipotent lineage peaks exclusively intersected with HSC peaks displayed enrichment of motifs for transcription factors with known roles in lineage differentiation. Motifs were found using HOMER findMotifsGenome.pl function, with a background file containing the combined peak-lists of the other 4 cell types. The top 10 results, as ranked by p-value from the known_motifs.html output, are shown. d In MkP/HSC peaks, Gata family peaks made up 5 of the top 10 hits, followed by ERG, Runx1, and fusions EWS:FL1 and EWS:ERG. e EP/HSC-enriched motifs also contained Gata factors, as well as the combination Gata:SCL motif and the known beta-globin locus control binder NFE2 and its paralog NFE2L2. f GM/HSCs had CEBPa and PU.1 motifs as top hits, along with ETS transcription factor binding sites. g B cell/HSC-enriched motifs had CTCF with CTCFL (BORIS) as the top two hits. B cells/HSC peaks also had E2A motifs enriched, as well as Ascl2, Slug, and ZEB1/2. h Tcf7 motif was the top hit for T cell/HSC-shared peaks, along with CTCF and Tbx5/6. Similar to the B-cell/HSC list, the T-cell/HSC list was also enriched for E2A motifs
Fig. 5
Fig. 5
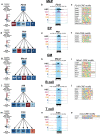
Examples of cis-element priming of lineage-specific genes in HSCs. a GEXC expression data reported expression of Thrombin receptor like 2 (F2lr2) selectively in MkPs. b A cis-element predicted to be associated with F2rl2 by GREAT was accessible in both MkPs and HSCs, but not in any other unipotent cell type. c The F2rl2 CRE contained the transcription factor binding motifs for 9 out of the top 10 enriched motifs in MkPs. The only motif not present is Runx1. d GEXC expression data reported expression of Pyruvate kinase liver and red blood cell (Pklr) in EPs, and not any other cell type. e A cis-element predicted to be associated with Pklr by GREAT was accessible in both EPs and HSCs, but not in any other unipotent cell type. f The Pklr CRE contained the binding motifs for Gata2, Gata4, Gata3 and TRPS1. g GEXC expression data reported selective expression of Mitochondrial tumor suppressor 1 (Mtus1) in GMs and no expression in any other cell type. h A cis-element predicted to be associated with Mtus1 by GREAT was accessible in both GMs and HSCs. i CEBP, CEBP:AP1, HLF, PU.1, NFL3, ETS1, and EHF binding motifs were present in the Mtus1 CRE reported in h. j GEXC expression data reported Interferon regulatory factor 8 (Irf8) expression only in B cells, not in the other unipotent lineage cells or in HSCs. k A cis-element predicted by GREAT to be associated with Irf8 was accessible in both B cells and HSCs. l ZEB1/2, Slug, Ascl2, HEB, and E2A binding motifs were found within the Irf8 CRE displayed in k. m GEXC expression data reported Inducible T cell co-stimulator (Icos) expression only in T cells, but not in the other unipotent lineage cells or HSCs. n A cis-element predicted by GREAT to be associated with Icos was accessible in both T cells and HSCs. o CTCF and WT1 motifs were found within the Icos CRE displayed in n

Similar articles

Cited by

References

    1. An X, Schulz VP, Li J, Wu K, Liu J, Xue F, Hu J, Mohandas N, Gallagher PG. Global transcriptome analyses of human and murine terminal erythroid differentiation. Blood. 2014;123:3466–3477. doi: 10.1182/blood-2014-01-548305. - DOI - PMC - PubMed
    1. Bender MA, Ragoczy T, Lee J, Byron R, Telling A, Dean A, Groudine M. The hypersensitive sites of the murine β-globin locus control region act independently to affect nuclear localization and transcriptional elongation. Blood. 2012;119:3820–3827. doi: 10.1182/blood-2011-09-380485. - DOI - PMC - PubMed
    1. Bernstein BE, Mikkelsen TS, Xie X, Kamal M, Huebert DJ, Cuff J, Fry B, Meissner A, Wernig M, Plath K, et al. A bivalent chromatin structure marks key developmental genes in embryonic stem cells. Cell. 2006;125:315–326. doi: 10.1016/j.cell.2006.02.041. - DOI - PubMed
    1. Boyer SW, Schroeder AV, Smith-Berdan S, Forsberg EC. All hematopoietic cells develop from hematopoietic stem cells through Flk2/Flt3-positive progenitor cells. Cell Stem Cell. 2011;9:64–73. doi: 10.1016/j.stem.2011.04.021. - DOI - PMC - PubMed
    1. Boyer SW, Beaudin AE, Forsberg EC. Mapping differentiation pathways from hematopoietic stem cells using Flk2/Flt3 lineage tracing. Cell Cycle. 2012;11:3180–3188. doi: 10.4161/cc.21279. - DOI - PMC - PubMed

Publication types

  NODES
Association 1
Project 1
twitter 2