. 2021 Apr 5;220(4):e202008121.
doi: 10.1083/jcb.202008121.

A novel dual Ca2+ sensor system regulates Ca2+-dependent neurotransmitter release

Affiliations

A novel dual Ca2+ sensor system regulates Ca2+-dependent neurotransmitter release

Lei Li et al. J Cell Biol. .

Abstract

Ca2+-dependent neurotransmitter release requires synaptotagmins as Ca2+ sensors to trigger synaptic vesicle (SV) exocytosis via binding of their tandem C2 domains-C2A and C2B-to Ca2+. We have previously demonstrated that SNT-1, a mouse synaptotagmin-1 (Syt1) homologue, functions as the fast Ca2+ sensor in Caenorhabditis elegans. Here, we report a new Ca2+ sensor, SNT-3, which triggers delayed Ca2+-dependent neurotransmitter release. snt-1;snt-3 double mutants abolish evoked synaptic transmission, demonstrating that C. elegans NMJs use a dual Ca2+ sensor system. SNT-3 possesses canonical aspartate residues in both C2 domains, but lacks an N-terminal transmembrane (TM) domain. Biochemical evidence demonstrates that SNT-3 binds both Ca2+ and the plasma membrane. Functional analysis shows that SNT-3 is activated when SNT-1 function is impaired, triggering SV release that is loosely coupled to Ca2+ entry. Compared with SNT-1, which is tethered to SVs, SNT-3 is not associated with SV. Eliminating the SV tethering of SNT-1 by removing the TM domain or the whole N terminus rescues fast release kinetics, demonstrating that cytoplasmic SNT-1 is still functional and triggers fast neurotransmitter release, but also exhibits decreased evoked amplitude and release probability. These results suggest that the fast and slow properties of SV release are determined by the intrinsically different C2 domains in SNT-1 and SNT-3, rather than their N-termini-mediated membrane tethering. Our findings therefore reveal a novel dual Ca2+ sensor system in C. elegans and provide significant insights into Ca2+-regulated exocytosis.


Figures

Figure S1.
Figure S1.
Domain structure of the seven Syt genes in C. elegans. The TM domain and the C2 domains (C2A and C2B) in each Syt isoform are indicated.
Figure 1.
Figure 1.
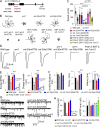
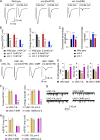
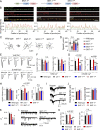
SNT-3 mediates evoked neurotransmitter release in the absence of SNT-1. (A) Schematic of the snt-3 gene. Black boxes represent the coding exons. The ky1034 early stop codon and the tm5776 deletion were indicated. (B) Representative locomotory trajectories of 10 animals for each indicated genotypes, including WT, snt-1, snt-3(tm5776), snt-3(ky1034), snt-1;snt-3(tm5776), snt-1;snt-3(ky1034), SNT-3 rescue by overexpression (OE) and single-copy insertion (SCI) in snt-3 single mutants, and SNT-3 overexpression rescue in snt-1;snt-3 double mutants. The starting points of each trajectory have been aligned for clarity. (C) Quantification of the average locomotion speed for the indicated genotypes or transgenes in B. Data are mean ± SEM. ***P < 0.001 compared with WT; ###P < 0.001 compared with snt-1 mutants. n.s., nonsignificant compared with WT (one-way ANOVA). (D) Example traces of evoked EPSCs recorded from body wall muscle. (E) Summary of the mean amplitude and charge transfer of the evoked EPSCs in D. Data are mean ± SEM. ***P < 0.001 compared with WT; ###P < 0.001 compared with snt-1 mutants. n.s., nonsignificant compared with WT (one-way ANOVA). (F) Quantifications of the rise time, decay, and latency of evoked EPSCs. Data are mean ± SEM. ***P < 0.001 compared with WT. n.s., nonsignificant compared with WT (one-way ANOVA following Kruskal-Wallis test). (G) Representative traces of mEPSCs. (H) Summary of the mean frequency and amplitude of the mEPSCs for each genotype or transgene. Data are mean ± SEM. **P < 0.01, ***P < 0.001 compared with WT; ##P < 0.01, compared to snt-1 mutants; n.s., nonsignificant compared with snt-1 mutants (one-way ANOVA).
Figure S2.
Figure S2.
The loss of both SNT-1 and SNT-3 leads to dramatically shorter body length. (A) Representative worm images from indicated genotypes, including WT, snt-1, snt-3(tm5776), snt-3(ky1034), snt-1;snt-3(tm5776), and snt-1;snt-3(ky1034). Scale bar, 400 µm. (B) Quantification of body length. Body length was measured by using WormLab software. Data are mean ± SEM. ***P < 0.001 compared with WT. n.s., nonsignificant compared with WT (one-way ANOVA).
Figure S3.
Figure S3.
The loss of snt-1 or snt-3 does not alter mEPSC decay. (A) Representative mEPSC traces from the indicated genotypes. (B) Quantification of mEPSC decay from the same genotypes in A. Data are mean ± SEM.
Figure S4.
Figure S4.
SNT-1 and SNT-3 alter mEPSC amplitude. Cumulative probability distributions of mEPSC amplitude from the indicated genotypes and transgenes, including WT, snt-1, snt-1;snt-3(tm5776), snt-1;snt-3(ky1034), and SNT-3 overexpression rescue.
Figure 2.
Figure 2.
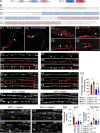
Expression pattern and subcellular localization of SNT-3 in cholinergic motor neurons. (A and B) Domain structure and sequence alignment of the SNT-1 and SNT-3. The transmembrane domain (green), the C2A domain (light blue), and the C2B domain (light red) are highlighted. (C1–C6) Expression of snt-3 driven by the endogenous snt-3 promoter in various regions (arrow, neuron; star, muscle), including head neurons, tail neurons, motor neurons, head muscles, and body wall muscles. Scale bar, 50 µm. (D1–D6) Expression snt-3 (driven by the snt-3 promoter; red) in both cholinergic and GABAergic motor neurons (driven by the unc-17 and unc-25 promoters, respectively; green) at the ventral nerve cord. Scale bar, 20 µm. (E1–E6) Fluorescent images of the dorsal nerve cord (under the unc-129 promoter) showing colocalization of SNT-3::mApple with Rab3::GFP (SV marker) and SNT-1::GFP. Scale bar, 5 µm. (F1–F4) Expression patterns of SNT-1::mApple and SNT-3::mApple in WT and unc-13(s69) mutant background, respectively. Scale bar, 5 µm. (F5) Averaged percentage of the bouton fluorescence to the total axonal fluorescence of SNT-1::mApple and SNT-3::mApple in WT and unc-13 mutants. Data are mean ± SEM. ***P < 0.001. n.s., nonsignificant (one-way ANOVA). (G1–G4) Distribution of SNT-1::mApple and SNT-3::mApple in the dorsal or ventral nerve cords of WT and unc-104 KIF1A mutants are compared. SNT-1::mApple axonal fluorescence (dorsal nerve cord [DNC]) decreased, while cell body fluorescence (ventral nerve cord [VNC]) increased in unc-104 mutants, whereas SNT-3::mApple axonal fluorescence and cell body fluorescence were comparable between WT and unc-104 mutants. Stars indicate the cell bodies in VNC, and arrows indicate axons in DNC. Scale bar, 5 µm. (G5) Quantification of somatic and axonal fluorescence intensity of SNT-1::mApple and SNT-3::mApple in WT and unc-104 mutants. Data are mean ± SEM. ****P < 0.0001. n.s., nonsignificant (one-way ANOVA).
Figure S5.
Figure S5.
Body wall muscles respond normally to ACh in snt-3 mutants. (A) Example traces of puff ACh-activated currents in WT and snt-3 mutants. (B) Quantification of current amplitude in A. Data are mean ± SEM.
Figure 3.
Figure 3.
SNT-3 binds Ca2+ and membranes. (A and B) The Ca2+-binding properties of SNT-3 were measured by ITC; raw data (A) and integrated and normalized data (B) fitted with a 1:1 binding model. The average binding affinity (dissociation constant[Kd]) was calculated by carrying out three independent titrations. (C and D) Ca2+-dependent membrane interactions of WT and mutant versions of SNT-1 C2AB and SNT-3 C2AB were determined with liposome cosedimentation experiments. Representative images of SDS-PAGE gels are shown in C. “+ Ca2+” indicates 1 mM Ca2+, and “- Ca2+” indicates 1 mM EGTA. The percentage of protein in pellets was quantified by using ImageJ and plotted in D. Cosedimentation experiments were independently repeated five times for SNT-1 C2AB and four times for SNT-3 C2AB variants.
Figure 4.
Figure 4.
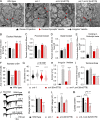
Roles of SNT-3 in SV docking and priming. (A) Representative synaptic profiles of the indicated genotypes, including WT, snt-1 mutant, snt-3 mutant, and snt-1;snt-3 double mutant. Arrowhead indicates docked vesicles; star indicates DP, arrow indicates irregular vesicles. Scale bar, 200nm. (B–E) Quantification of docked SVs, docked within 90 nm of DP, docked between 91 and 300 nm from the DP, and docked between 301 and 510 nm from the DP from same genotypes as in A. The number of SVs docked at the plasma membrane was significantly increased in snt-3 mutants and snt-1;snt-3 double mutants, but unchanged in snt-1 mutants. The number of SVs docked within 90 nm of the DP was reduced, though not to significance, in snt-1 mutants, but unchanged in snt-3 mutants and snt-1;snt-3 double mutants. There was a significant increase in SVs docked between 91 and 300 nm from the DP in both snt-3 mutants and snt-1;snt-3 double mutants. Vesicles docked between 301 and 510 nm from the DP were significantly increased in snt-1 mutants, with no change in snt-3 mutants or snt-1;snt-3 double mutants. Data are mean ± SEM. *P < 0.05; **P < 0.01 compared with WT (one-way ANOVA). (F–I) Quantification of total SV numbers, diameter of SVs (nm), number of irregular vesicles, and size of the terminal area (nm2) from the same genotypes as in A. The total number of SVs was significantly decreased in snt-1 mutants, with no change in snt-3 mutants and snt-1;snt-3 double mutants. The vesicle diameter was significantly increased in snt-1 mutants, but significantly decreased in the snt-3 mutant and snt-1;snt-3 double mutants. There was an increase in the number of irregular vesicles in snt-1 mutants and snt-1;snt-3 double mutants, but no significant change in snt-3 mutants. The terminal area was significantly reduced in the snt-3 mutants and snt-1;snt-3 double mutants, with no change in snt-1 mutants. Data are mean ± SEM. ****P < 0.0001 compared with WT (one-way ANOVA). (J) Hypertonic sucrose-evoked current recorded from WT, snt-1 mutants, snt-3 mutants, and snt-1;snt-3 double mutants. (K–M) Quantification of averaged charge transfer in the sucrose-evoked currents, averaged mEPSC charge, and quantal content from the indicated genotypes. Data are mean ± SEM. *P < 0.05; ***P < 0.001 compared with WT. n.s., nonsignificant (one-way ANOVA following Kruskal-Wallis test).
Figure S6.
Figure S6.
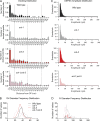
Differential roles of SNT-1 and SNT-3 in docking and vesicle size. (A) Distribution of docked vesicles as a measure of distance from the DP (nm) in 30-nm bins. Vesicles docked within 90 nm of the DP are considered proximal, vesicles docked 91–300 nm from the DP are considered distal, and vesicles docked from 301–510 nm from the DP are considered to be docked within the endocytic zone. (B) Frequency distribution of SV diameters. snt-1 mutants show a right shift in the frequency of SV diameter. snt-3 mutants show a left shift in the frequency of SV diameters, which is further shifted in the snt-1;snt-3 double mutants. (C) mEPSC amplitude histograms from indicated genotypes. (D) Frequency distribution of irregular vesicle (IV) diameters. snt-1 mutants show a right shift in the frequency of irregular vesicle diameter, whereas snt-1;snt-3 double mutants show a right shift in the diameter distribution of irregular vesicle diameter.
Figure 5.
Figure 5.
SNT-3 triggers release of SVs that have loose coupling with Ca2+ entry. (A) Representative traces of evoked EPSCs from WT, snt-1, and snt-3 mutants in 1 mM and 0.5 mM Ca2+. (B) Summary of the mean amplitude and charge transfer of evoked EPSCs in A. Data are mean ± SEM. ***P < 0.001 compared with the same genotype in 1 mM Ca2+ (Student’s t test). (C) Decreased percentage of evoked EPSC amplitude and charge transfer in 0.5 mM Ca2+ compared with that in 1 mM Ca2+ from the indicated genotypes. Data are mean ± SEM. ***P < 0.001 compared with WT. n.s., nonsignificant compared with WT (one-way ANOVA). (D and G) Example traces of mEPSCs and evoked EPSCs from the indicated genotypes, including UNC-13L rescue, UNC-13L;snt-3, UNC-13MR rescue, and UNC-13MR;snt-3. (E) Averaged 10% to 90% rise time, inactivation decay, and latency from evoked EPSCs in UNC-13L and UNC-13MR rescued animals. Data are mean ± SEM. *P < 0.05; **P < 0.01; ***P < 0.001 compared with WT (one-way ANOVA). (F and H) Quantification of evoked EPSC amplitude and charge transfer, and mEPSC frequency and amplitude from the same genotypes in D and F. Data are mean ± SEM. ***P < 0.001 compared with UNC-13MR rescue (one-way ANOVA).
Figure 6.
Figure 6.
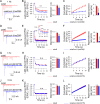
SNT-1 and SNT-3 have differential roles in synaptic depression and replenishment. Synaptic depression and SV replenishment were investigated by applying a train light stimulus (1 Hz and 5 Hz) onto the ventral nerve cord of control animals (zxIs6) and snt-1(md290) and snt-3(tm5776) mutants with expression of ChR2 in their cholinergic motor neurons. (A, D, G, and J) Example traces of 1-Hz and 5-Hz light train stimulus–evoked EPSCs from zxIs6 (red), zxIs6;snt-1 (blue), and zxIs6;snt-3 (blue) animals. (B, E, H, and K) Quantification of synaptic depression by normalizing the EPSC amplitude (EPSCi) to the first EPSC amplitude (EPSC1), and depression τ of the normalized EPSC amplitude (calculated by fitting the normalized depression curve using monoexponential function; dashed gray curve). Data are mean ± SEM. n.s., nonsignificant. *P < 0.05; **P < 0.01; ***P < 0.001 compared with zxIs6 (Mann-Whitney test). (C, F, I, and L) Averaged cumulative EPSC amplitudes during 1-Hz and 5-Hz trains, and quantification of the replenishment rate. Replenishment rate was described by the slope of the cumulative EPSCs and calculated by a line fit through the linear section (dashed gray line). Data are mean ± SEM. ****P < 0.0001 compared with zxIs6 (Student’s t test).
Figure 7.
Figure 7.
SNT-3 triggers a delayed release when SNT-1 binding Ca2+ is impaired. (A) Representative images showing the SNT-3::mApple distribution in cholinergic axons in WT and snt-1 mutant background. Scale bar, 5 µm. (B) Quantification of fluorescence intensity of SNT-3::mApple. Data are mean ± SEM. n.s., nonsignificant (Student’s t test). (C–E) Example traces of evoked EPSCs and summary of the EPSC amplitude, charge transfer, and latency. Data are mean ± SEM. ***P < 0.001 compared with WT; ###P < 0.001 compared with SNT-1C2AB D3,4N;snt-1;snt-3 transgenes. n.s., nonsignificant (one-way ANOVA). (F and G) Example traces of hypertonic sucrose-evoked currents, and quantification of charge transfer and quantal content of the sucrose-evoked currents. Data are mean ± SEM. *P < 0.05 (one-way ANOVA). (H and I) Representative mEPSC traces and summary of mEPSC frequency and amplitude from the indicated genotypes and transgenes. Data are mean ± SEM. **P < 0.01, ***P < 0.001 compared with WT; ##P < 0.01 compared with SNT-1C2AB D3,4N;snt-1;snt-3 transgenes. n.s., nonsignificant (one-way ANOVA following Kruskal-Wallis test).
Figure 8.
Figure 8.
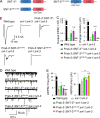
Ca2+ binding by the C2B domain in SNT-3 triggers delayed evoked neurotransmitter release. (A) WT (SNT-3FL) and mutated SNT-3 rescue constructs containing Ca2+-binding mutations in the C2A or C2B domains (SNT-3C2A DN, SNT-3C2B DN). (B and C) Representative traces of evoked EPSCs, and quantification of the EPSC amplitude and charge transfer from the indicated genotypes and transgenes. Disrupting Ca2+ binding in the C2B domain, but not the C2A domain, in SNT-3 blocked SNT-3–mediated evoked EPSCs. Data are mean ± SEM. **P < 0.01, ***P < 0.001 compared with WT; ###P < 0.001 compared with SNT-3C2AB;snt-1;snt-3 transgenes. n.s., nonsignificant compared with SNT-3C2AB;snt-1;snt-3 transgenes (one-way ANOVA). (D and E) Example mEPSC traces and averaged mEPSC frequency and amplitude from the indicated genotypes and transgenes. Data are mean ± SEM. **P < 0.05, ***P < 0.001 compared with WT; **P < 0.01 compared to snt-1;snt-3 double mutants; ###P < 0.001 compared with SNT-3C2AB;snt-1;snt-3 transgenes. n.s., nonsignificant compared with SNT-3C2AB;snt-1;snt-3 transgenes (one-way ANOVA).
Figure S7.
Figure S7.
Effects of overexpression of WT or mutated SNT-3 on mEPSC amplitude in snt-1;snt-3 double mutants. Cumulative probability distributions of mEPSC amplitude from the indicated genotypes and transgenes, including WT, snt-1, snt-1;snt-3(tm5776), snt-1;snt-3(ky1034), and SNT-3 overexpression rescue.
Figure 9.
Figure 9.
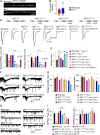
Cytoplasmic SNT-1 supports locomotion and triggers fast neurotransmitter release. (A) Generation of cytoplasmic SNT-1 rescue constructs (SNT-1ΔTM and SNT-1ΔN). (B) Synaptic localization of SNT-1::mApple, SNT-1ΔTM::mApple, and SNT-1ΔN::mApple in cholinergic axons (under the unc-129 promoter). Both cytoplasmic SNT-1 constructs display similar distribution with the full-length SNT-1 and exhibit well colocalization with the active zone marker UNC-10::GFP. (C and D) Representative locomotory trajectories and quantification of the average locomotion speed for the indicated genotypes, including WT, snt-1, full-length SNT-1 rescue, and cytoplasmic SNT-1 rescue (SNT-1ΔTM and SNT-1ΔN) in snt-1 mutants. Data are mean ± SEM. ***P < 0.001 compared with WT; ###P < 0.001 compared with snt-1 mutants. n.s., nonsignificant (one-way ANOVA). (E–H) Example traces of evoked EPSCs recorded in both 1 mM and 0.5 mM Ca2+ solution, and quantification of the EPSC amplitude, charge transfer, and latency from the same genotypes and transgenes in C. Data are mean ± SEM. ***P < 0.001 compared with WT; ##P < 0.01, ###P < 0.001 compared with full-length SNT-1 rescue. n.s., nonsignificant (one-way ANOVA). (I and J) Example traces of hypertonic sucrose-evoked currents, and quantification of charge transfer and quantal content from snt-1 mutants rescued by full-length or cytoplasmic SNT-1. Data are mean ± SEM. (K) Quantification of the release probability (Pvr). Data are mean ± SEM. #P < 0.05; ##P < 0.01 compared with full-length SNT-1 rescue (one-way ANOVA). (L and M) Example mEPSC traces and averaged mEPSC frequency and amplitude from the indicated genotypes and transgenes. Data are mean ± SEM. **P < 0.01; ***P < 0.001 compared with WT; ###P < 0.001 compared with full-length SNT-1 rescue. n.s., nonsignificant (one-way ANOVA).
Figure S8.
Figure S8.
The individual C2A and C2B domains of SNT-1 are localized at active zones. The mApple-tagged C2A or C2B domain of SNT-1 are expressed in the D-type cholinergic motor neurons (under the unc-129 promoter). They both exhibit well colocalization with the active zone marker UNC-10::GFP. (Upper) Representative images of UNC-10::GFP, C2A::mApple, and C2B::mApple. (Bottom) Line scans along the dorsal nerve cord. Scale bar, 5 µm.
Figure S9.
Figure S9.
Cytoplasmic SNT-1 significantly rescued body length in snt-1 mutants. (Left) Representative worm images from indicated genotypes, including WT, snt-1, and SNT-1ΔTM and SNT-1ΔN rescue worms. Scale bar, 500 µm. (Right) Quantification of body length. Body length was measured by using WormLab software. Data are mean ± SEM. ***P < 0.001 compared with WT; ###P < 0.001 compared with snt-1 mutants (one-way ANOVA).
Figure S10.
Figure S10.
Deleting the TM domain or the whole N terminus in SNT-1 does not alter the mEPSC decay. (A) Representative mEPSC traces from the indicated genotypes and transgenes. (B and C) Quantification of mEPSC decay and charge from the same genotypes in A. Data are mean ± SEM. ***P < 0.001 compared with WT. n.s., nonsignificant (one-way ANOVA).
Figure S11.
Figure S11.
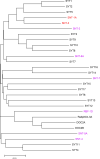
Phylogenetic tree of worm and mouse Syts. Sequences were aligned by using clustal omega with default parameters, and the phylogenetic tree was created with MEGA-X (Molecular Evolutionary Genetics Analysis).

Comment in

Similar articles

Cited by

References

    1. Awasthi, A., Ramachandran B., Ahmed S., Benito E., Shinoda Y., Nitzan N., Heukamp A., Rannio S., Martens H., Barth J., et al. . 2019. Synaptotagmin-3 drives AMPA receptor endocytosis, depression of synapse strength, and forgetting. Science. 363:eaav1483. 10.1126/science.aav1483 - DOI - PubMed
    1. Bacaj, T., Wu D., Yang X., Morishita W., Zhou P., Xu W., Malenka R.C., and Südhof T.C.. 2013. Synaptotagmin-1 and synaptotagmin-7 trigger synchronous and asynchronous phases of neurotransmitter release. Neuron. 80:947–959. 10.1016/j.neuron.2013.10.026 - DOI - PMC - PubMed
    1. Bacaj, T., Wu D., Burré J., Malenka R.C., Liu X., and Südhof T.C.. 2015. Synaptotagmin-1 and -7 Are Redundantly Essential for Maintaining the Capacity of the Readily-Releasable Pool of Synaptic Vesicles. PLoS Biol. 13:e1002267. 10.1371/journal.pbio.1002267 - DOI - PMC - PubMed
    1. Becherer, U., and Rettig J.. 2006. Vesicle pools, docking, priming, and release. Cell Tissue Res. 326:393–407. 10.1007/s00441-006-0243-z - DOI - PubMed
    1. Bouhours, B., Gjoni E., Kochubey O., and Schneggenburger R.. 2017. Synaptotagmin2 (Syt2) Drives Fast Release Redundantly with Syt1 at the Output Synapses of Parvalbumin-Expressing Inhibitory Neurons. J. Neurosci. 37:4604–4617. 10.1523/JNEUROSCI.3736-16.2017 - DOI - PMC - PubMed

Publication types

MeSH terms

  NODES
twitter 2