Identification of Tumor Mutation Burden and Immune Infiltrates in Hepatocellular Carcinoma Based on Multi-Omics Analysis
- PMID: 33681288
- PMCID: PMC7928364
- DOI: 10.3389/fmolb.2020.599142
Identification of Tumor Mutation Burden and Immune Infiltrates in Hepatocellular Carcinoma Based on Multi-Omics Analysis
Abstract
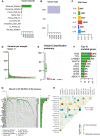
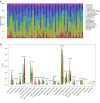
We aimed to explore the tumor mutational burden (TMB) and immune infiltration in HCC and investigate new biomarkers for immunotherapy. Transcriptome and gene mutation data were downloaded from the GDC portal, including 374 HCC samples and 50 matched normal samples. Furthermore, we divided the samples into high and low TMB groups, and analyzed the differential genes between them with GO, KEGG, and GSEA. Cibersort was used to assess the immune cell infiltration in the samples. Finally, univariate and multivariate Cox regression analyses were performed to identify differential genes related to TMB and immune infiltration, and a risk prediction model was constructed. We found 10 frequently mutated genes, including TP53, TTN, CTNNB1, MUC16, ALB, PCLO, MUC, APOB, RYR2, and ABCA. Pathway analysis indicated that these TMB-related differential genes were mainly enriched in PI3K-AKT. Cibersort analysis showed that memory B cells (p = 0.02), CD8+ T cells (p = 0.09), CD4+ memory activated T cells (p = 0.07), and neutrophils (p = 0.06) demonstrated a difference in immune infiltration between high and low TMB groups. On multivariate analysis, GABRA3 (p = 0.05), CECR7 (p < 0.001), TRIM16 (p = 0.003), and IL7R (p = 0.04) were associated with TMB and immune infiltration. The risk prediction model had an area under the curve (AUC) of 0.69, suggesting that patients with low risk had better survival outcomes. Our study demonstrated for the first time that CECR7, GABRA3, IL7R, and TRIM16L were associated with TMB and promoted antitumor immunity in HCC.
Keywords: biomarkers; hepatocellular carcinoma; immune infiltration; prognosis; tumor mutation burden.
Copyright © 2021 Yin, Zhou and Xu.
Conflict of interest statement
The authors declare that the research was conducted in the absence of any commercial or financial relationships that could be construed as a potential conflict of interest.
Figures


Similar articles
-
Exploration of the relationships between tumor mutation burden with immune infiltrates in clear cell renal cell carcinoma.Ann Transl Med. 2019 Nov;7(22):648. doi: 10.21037/atm.2019.10.84. Ann Transl Med. 2019. PMID: 31930049 Free PMC article.
-
Correlation analysis of tumor mutation burden of hepatocellular carcinoma based on data mining.J Gastrointest Oncol. 2021 Jun;12(3):1117-1131. doi: 10.21037/jgo-21-259. J Gastrointest Oncol. 2021. PMID: 34295561 Free PMC article.
-
Multi-omics analysis of tumor mutation burden combined with immune infiltrates in melanoma.Clin Chim Acta. 2020 Dec;511:306-318. doi: 10.1016/j.cca.2020.10.030. Epub 2020 Oct 24. Clin Chim Acta. 2020. PMID: 33164879
-
Tumor Mutation Burden, Immune Cell Infiltration, and Construction of Immune-Related Genes Prognostic Model in Head and Neck Cancer.Int J Med Sci. 2021 Jan 1;18(1):226-238. doi: 10.7150/ijms.51064. eCollection 2021. Int J Med Sci. 2021. PMID: 33390791 Free PMC article.
-
Identifying CD1c as a potential biomarker by the comprehensive exploration of tumor mutational burden and immune infiltration in diffuse large B cell lymphoma.PeerJ. 2023 Dec 11;11:e16618. doi: 10.7717/peerj.16618. eCollection 2023. PeerJ. 2023. PMID: 38099311 Free PMC article.
Cited by
-
Subgrouping testicular germ cell tumors based on immunotherapy and chemotherapy associated lncRNAs.Heliyon. 2024 Jan 8;10(2):e24320. doi: 10.1016/j.heliyon.2024.e24320. eCollection 2024 Jan 30. Heliyon. 2024. PMID: 38298718 Free PMC article.
-
Key oncogenic signaling pathways affecting tumor-infiltrating lymphocytes infiltration in hepatocellular carcinoma: basic principles and recent advances.Front Immunol. 2024 Feb 15;15:1354313. doi: 10.3389/fimmu.2024.1354313. eCollection 2024. Front Immunol. 2024. PMID: 38426090 Free PMC article. Review.
-
Tumor Mutational Burden for Predicting Prognosis and Therapy Outcome of Hepatocellular Carcinoma.Int J Mol Sci. 2023 Feb 8;24(4):3441. doi: 10.3390/ijms24043441. Int J Mol Sci. 2023. PMID: 36834851 Free PMC article. Review.
-
IFDlong: an isoform and fusion detector for accurate annotation and quantification of long-read RNA-seq data.bioRxiv [Preprint]. 2024 May 14:2024.05.11.593690. doi: 10.1101/2024.05.11.593690. bioRxiv. 2024. PMID: 38798496 Free PMC article. Preprint.
-
Immune checkpoint molecules are regulated by transforming growth factor (TGF)-β1-induced epithelial-to-mesenchymal transition in hepatocellular carcinoma.Int J Med Sci. 2021 Apr 22;18(12):2466-2479. doi: 10.7150/ijms.54239. eCollection 2021. Int J Med Sci. 2021. PMID: 34104078 Free PMC article.
References
-
- Buchbinder E. I., Dutcher J. P., Daniels G. A., Curti B. D., Patel S. P., Holtan S. G., et al. (2019). Therapy with high-dose Interleukin-2 (HD IL-2) in metastatic melanoma and renal cell carcinoma following PD1 or PDL1 inhibition. J. Immunother. Cancer 7 (1), 49. 10.1186/s40425-019-0522-3 - DOI - PMC - PubMed
-
- Chardin D., Paquet M., Schiappa R., Darcourt J., Bailleux C., Poudenx M., et al. (2020). Baseline metabolic tumor volume as a strong predictive and prognostic biomarker in patients with non-small cell lung cancer treated with PD1 inhibitors: a prospective study. J. Immunother. Cancer 8 (2), e000645. 10.1136/jitc-2020-000645 - DOI - PMC - PubMed
-
- Chen Y., Liu Q., Chen Z., Wang Y., Yang W., Hu Y., et al. (2019b). PD-L1 expression and tumor mutational burden status for prediction of response to chemotherapy and _targeted therapy in non-small cell lung cancer. J. Exp. Clin. Cancer Res. 38 (1), 193. 10.1186/s13046-019-1192-1 - DOI - PMC - PubMed
LinkOut - more resources
Full Text Sources
Other Literature Sources
Research Materials
Miscellaneous

