Identification and Validation of a Novel DNA Damage and DNA Repair Related Genes Based Signature for Colon Cancer Prognosis
- PMID: 33719345
- PMCID: PMC7943631
- DOI: 10.3389/fgene.2021.635863
Identification and Validation of a Novel DNA Damage and DNA Repair Related Genes Based Signature for Colon Cancer Prognosis
Abstract
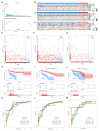
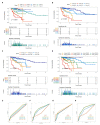
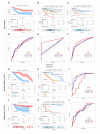
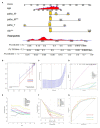
Backgrounds: Colorectal cancer (CRC) with high incidence, has the third highest mortality of tumors. DNA damage and repair influence a variety of tumors. However, the role of these genes in colon cancer prognosis has been less systematically investigated. Here, we aim to establish a corresponding prognostic signature providing new therapeutic opportunities for CRC. Method: After related genes were collected from GSEA, univariate Cox regression was performed to evaluate each gene's prognostic relevance through the TCGA-COAD dataset. Stepwise COX regression was used to establish a risk prediction model through the training sets randomly separated from the TCGA cohort and validated in the remaining testing sets and two GEO datasets (GSE17538 and GSE38832). A 12-DNA-damage-and-repair-related gene-based signature able to classify COAD patients into high and low-risk groups was developed. The predictive ability of the risk model or nomogram were evaluated by different bioinformatics- methods. Gene functional enrichment analysis was performed to analyze the co-expressed genes of the risk-based genes. Result: A 12-gene based prognostic signature established within 160 significant survival-related genes from DNA damage and repair related gene sets performed well with an AUC of ROC 0.80 for 5 years in the TCGA-CODA dataset. The signature includes CCNB3, ISY1, CDC25C, SMC1B, MC1R, LSP1P4, RIN2, TPM1, ELL3, POLG, CD36, and NEK4. Kaplan-Meier survival curves showed that the prognosis of the risk status owns more significant differences than T, M, N, and stage prognostic parameters. A nomogram was constructed by LASSO regression analysis with T, M, N, age, and risk as prognostic parameters. ROC curve, C-index, Calibration analysis, and Decision Curve Analysis showed the risk module and nomogram performed best in years 1, 3, and 5. KEGG, GO, and GSEA enrichment analyses suggest the risk involved in a variety of important biological processes and well-known cancer-related pathways. These differences may be the key factors affecting the final prognosis. Conclusion: The established gene signature for CRC prognosis provides a new molecular tool for clinical evaluation of prognosis, individualized diagnosis, and treatment. Therapies based on _targeted DNA damage and repair mechanisms may formulate more sensitive and potential chemotherapy regimens, thereby expanding treatment options and potentially improving the clinical outcome of CRC patients.
Keywords: DNA damage; DNA repair; colon cancer; mRNA signature; prediction; prognosis.
Copyright © 2021 Wang, Xu, Wang, Piao, Mao, Zhou, Wang, Wu, Ye and Li.
Conflict of interest statement
The authors declare that the research was conducted in the absence of any commercial or financial relationships that could be construed as a potential conflict of interest.
Figures


Similar articles
-
Identification and Validation of a Novel RNA-Binding Protein-Related Gene-Based Prognostic Model for Multiple Myeloma.Front Genet. 2021 Apr 26;12:665173. doi: 10.3389/fgene.2021.665173. eCollection 2021. Front Genet. 2021. PMID: 33981333 Free PMC article.
-
Identification of a glycolysis- and lactate-related gene signature for predicting prognosis, immune microenvironment, and drug candidates in colon adenocarcinoma.Front Cell Dev Biol. 2022 Aug 23;10:971992. doi: 10.3389/fcell.2022.971992. eCollection 2022. Front Cell Dev Biol. 2022. PMID: 36081904 Free PMC article.
-
Construction of mRNA prognosis signature associated with differentially expressed genes in early stage of stomach adenocarcinomas based on TCGA and GEO datasets.Eur J Med Res. 2022 Oct 17;27(1):205. doi: 10.1186/s40001-022-00827-4. Eur J Med Res. 2022. PMID: 36253873 Free PMC article.
-
Construction of a novel mRNA-signature prediction model for prognosis of bladder cancer based on a statistical analysis.BMC Cancer. 2021 Jul 27;21(1):858. doi: 10.1186/s12885-021-08611-z. BMC Cancer. 2021. PMID: 34315402 Free PMC article.
-
A Novel Prognostic Risk Model for Cervical Cancer Based on Immune Checkpoint HLA-G-Driven Differentially Expressed Genes.Front Immunol. 2022 Jul 18;13:851622. doi: 10.3389/fimmu.2022.851622. eCollection 2022. Front Immunol. 2022. PMID: 35924232 Free PMC article.
Cited by
-
Identification of Ferroptosis-Related Genes Signature Predicting the Efficiency of Invasion and Metastasis Ability in Colon Adenocarcinoma.Front Cell Dev Biol. 2022 Jan 26;9:815104. doi: 10.3389/fcell.2021.815104. eCollection 2021. Front Cell Dev Biol. 2022. PMID: 35155451 Free PMC article.
-
MC1R Is a Prognostic Marker and Its Expression Is Correlated with MSI in Colorectal Cancer.Curr Issues Mol Biol. 2021 Oct 11;43(3):1529-1547. doi: 10.3390/cimb43030108. Curr Issues Mol Biol. 2021. PMID: 34698109 Free PMC article.
-
Increased ATG5 Expression Predicts Poor Prognosis and Promotes EMT in Cervical Carcinoma.Front Cell Dev Biol. 2021 Nov 25;9:757184. doi: 10.3389/fcell.2021.757184. eCollection 2021. Front Cell Dev Biol. 2021. PMID: 34901004 Free PMC article.
-
Prognostic significance and immune landscape of a fatty acid metabolism-related gene signature in colon adenocarcinoma.Front Genet. 2022 Dec 9;13:996625. doi: 10.3389/fgene.2022.996625. eCollection 2022. Front Genet. 2022. PMID: 36568396 Free PMC article.
-
Construction of a Redox-Related Prognostic Model with Predictive Value in Survival and Therapeutic Response for Patients with Lung Adenocarcinoma.J Healthc Eng. 2022 Feb 25;2022:7651758. doi: 10.1155/2022/7651758. eCollection 2022. J Healthc Eng. 2022. PMID: 35251577 Free PMC article.
References
-
- Alvi M. A., Liu X., O'Donovan M., Newton R., Wernisch L., Shannon N. B., et al. . (2013). DNA methylation as an adjunct to histopathology to detect prevalent, inconspicuous dysplasia and early-stage neoplasia in Barrett's esophagus. Clin. Cancer Res. 19, 878–888. 10.1158/1078-0432.CCR-12-2880, PMID: - DOI - PMC - PubMed
LinkOut - more resources
Full Text Sources
Other Literature Sources
Research Materials
Miscellaneous

