Deep Learning Reveals Key Immunosuppression Genes and Distinct Immunotypes in Periodontitis
- PMID: 33777111
- PMCID: PMC7994531
- DOI: 10.3389/fgene.2021.648329
Deep Learning Reveals Key Immunosuppression Genes and Distinct Immunotypes in Periodontitis
Abstract
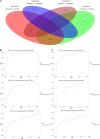
Background: Periodontitis is a chronic immuno-inflammatory disease characterized by inflammatory destruction of tooth-supporting tissues. Its pathogenesis involves a dysregulated local host immune response that is ineffective in combating microbial challenges. An integrated investigation of genes involved in mediating immune response suppression in periodontitis, based on multiple studies, can reveal genes pivotal to periodontitis pathogenesis. Here, we aimed to apply a deep learning (DL)-based autoencoder (AE) for predicting immunosuppression genes involved in periodontitis by integrating multiples omics datasets.
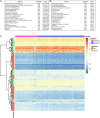
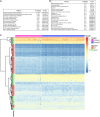
Methods: Two periodontitis-related GEO transcriptomic datasets (GSE16134 and GSE10334) and immunosuppression genes identified from DisGeNET and HisgAtlas were included. Immunosuppression genes related to periodontitis in GSE16134 were used as input to build an AE, to identify the top disease-representative immunosuppression gene features. Using K-means clustering and ANOVA, immune subtype labels were assigned to disease samples and a support vector machine (SVM) classifier was constructed. This classifier was applied to a validation set (Immunosuppression genes related to periodontitis in GSE10334) for predicting sample labels, evaluating the accuracy of the AE. In addition, differentially expressed genes (DEGs), signaling pathways, and transcription factors (TFs) involved in immunosuppression and periodontitis were determined with an array of bioinformatics analysis. Shared DEGs common to DEGs differentiating periodontitis from controls and those differentiating the immune subtypes were considered as the key immunosuppression genes in periodontitis.
Results: We produced representative molecular features and identified two immune subtypes in periodontitis using an AE. Two subtypes were also predicted in the validation set with the SVM classifier. Three "master" immunosuppression genes, PECAM1, FCGR3A, and FOS were identified as candidates pivotal to immunosuppressive mechanisms in periodontitis. Six transcription factors, NFKB1, FOS, JUN, HIF1A, STAT5B, and STAT4, were identified as central to the TFs-DEGs interaction network. The two immune subtypes were distinct in terms of their regulating pathways.
Conclusion: This study applied a DL-based AE for the first time to identify immune subtypes of periodontitis and pivotal immunosuppression genes that discriminated periodontitis from the healthy. Key signaling pathways and TF-_target DEGs that putatively mediate immune suppression in periodontitis were identified. PECAM1, FCGR3A, and FOS emerged as high-value biomarkers and candidate therapeutic _targets for periodontitis.
Keywords: autoencoder (AE); bioinformatics; deep learning; immunosuppression genes; periodontitis; therapeutic _targets.
Copyright © 2021 Ning, Acharya, Sun, Ogbuehi, Li, Hua, Ou, Zeng, Liu, Deng, Haak, Ziebolz, Schmalz, Pelekos, Wang and Hu.
Conflict of interest statement
The authors declare that the research was conducted in the absence of any commercial or financial relationships that could be construed as a potential conflict of interest.
Figures


Similar articles
-
Shared Molecular Mechanisms between Alzheimer's Disease and Periodontitis Revealed by Transcriptomic Analysis.Biomed Res Int. 2021 Apr 1;2021:6633563. doi: 10.1155/2021/6633563. eCollection 2021. Biomed Res Int. 2021. PMID: 33869630 Free PMC article.
-
Is Immune Suppression Involved in the Ischemic Stroke? A Study Based on Computational Biology.Front Aging Neurosci. 2022 Feb 10;14:830494. doi: 10.3389/fnagi.2022.830494. eCollection 2022. Front Aging Neurosci. 2022. PMID: 35250546 Free PMC article.
-
Identification of Endoplasmic Reticulum Stress-Related Biomarkers of Periodontitis Based on Machine Learning: A Bioinformatics Analysis.Dis Markers. 2022 Aug 29;2022:8611755. doi: 10.1155/2022/8611755. eCollection 2022. Dis Markers. 2022. PMID: 36072904 Free PMC article. Clinical Trial.
-
Genes related to inflammation and bone loss process in periodontitis suggested by bioinformatics methods.BMC Oral Health. 2015 Sep 4;15:105. doi: 10.1186/s12903-015-0086-7. BMC Oral Health. 2015. PMID: 26334995 Free PMC article.
-
Identification of hub genes and transcription factors involved in periodontitis on the basis of multiple microarray analysis.Hua Xi Kou Qiang Yi Xue Za Zhi. 2021 Dec 1;39(6):633-641. doi: 10.7518/hxkq.2021.06.003. Hua Xi Kou Qiang Yi Xue Za Zhi. 2021. PMID: 34859622 Free PMC article. Chinese, English.
Cited by
-
Artificial Intelligence in Periodontology: A Scoping Review.Dent J (Basel). 2023 Feb 8;11(2):43. doi: 10.3390/dj11020043. Dent J (Basel). 2023. PMID: 36826188 Free PMC article. Review.
-
Whole-transcriptome analysis of periodontal tissue and construction of immune-related competitive endogenous RNA network.BMC Oral Health. 2022 Aug 31;22(1):370. doi: 10.1186/s12903-022-02401-0. BMC Oral Health. 2022. PMID: 36045361 Free PMC article.
-
A Study of the Recent Trends of Immunology: Key Challenges, Domains, Applications, Datasets, and Future Directions.Sensors (Basel). 2021 Nov 23;21(23):7786. doi: 10.3390/s21237786. Sensors (Basel). 2021. PMID: 34883787 Free PMC article. Review.
-
Integrative Analysis of Deregulated miRNAs Reveals Candidate Molecular Mechanisms Linking H. pylori Infected Peptic Ulcer Disease with Periodontitis.Dis Markers. 2022 Jan 29;2022:1498525. doi: 10.1155/2022/1498525. eCollection 2022. Dis Markers. 2022. PMID: 35132337 Free PMC article.
-
Identifying Oxidative Stress-Related Genes (OSRGs) as Potential _target for Treating Periodontitis Based on Bioinformatics Analysis.Comb Chem High Throughput Screen. 2024;27(8):1191-1204. doi: 10.2174/1386207326666230821102623. Comb Chem High Throughput Screen. 2024. PMID: 37605414
References
-
- Ambili R., Santhi W. S., Janam P., Nandakumar K., Pillai M. R. (2005). Expression of activated transcription factor nuclear factor-kappaB in periodontally diseased tissues. J. Periodontol. 76 1148–1153. - PubMed
-
- Aoyagi T., Yamazaki K., Kabasawa-Katoh Y., Nakajima T., Yamashita N., Yoshie H., et al. (2000). Elevated CTLA-4 expression on CD4 T cells from periodontitis patients stimulated with Porphyromonas gingivalis outer membrane antigen: CTLA-4 expression in periodontitis. Clin. Exp. Immunol. 119 280–286. 10.1046/j.1365-2249.2000.01126.x - DOI - PMC - PubMed
LinkOut - more resources
Full Text Sources
Other Literature Sources
Miscellaneous

