. 2021 Apr 1:9:664178.
doi: 10.3389/fcell.2021.664178. eCollection 2021.

Differential Transcriptomes and Methylomes of Trophoblast Stem Cells From Naturally-Fertilized and Somatic Cell Nuclear-Transferred Embryos

Affiliations

Differential Transcriptomes and Methylomes of Trophoblast Stem Cells From Naturally-Fertilized and Somatic Cell Nuclear-Transferred Embryos

Jin Sun et al. Front Cell Dev Biol. .

Abstract

Trophoblast stem cells (TSCs) are critical to mammalian embryogenesis by providing the cell source of the placenta. TSCs can be derived from trophoblast cells. However, the efficiency of TSC derivation from somatic cell nuclear transfer (NT) blastocysts is low. The regulatory mechanisms underlying transcription dynamics and epigenetic landscape remodeling during TSC derivation remain elusive. Here, we derived TSCs from the blastocysts by natural fertilization (NF), NT, and a histone deacetylase inhibitor Scriptaid-treated NT (SNT). Profiling of the transcriptomes across the stages of TSC derivation revealed that fibroblast growth factor 4 (FGF4) treatment resulted in many differentially expressed genes (DEGs) at outgrowth and initiated transcription program for TSC formation. We identified 75 transcription factors (TFs) that are continuously upregulated during NF TSC derivation, whose transcription profiles can infer the time course of NF not NT TSC derivation. Most DEGs in NT outgrowth are rescued in SNT outgrowth. The correct time course of SNT TSC derivation is inferred accordingly. Moreover, these TFs comprise an interaction network important to TSC stemness. Profiling of DNA methylation dynamics showed an extremely low level before FGF4 treatment and gradual increases afterward. FGF4 treatment results in a distinct DNA methylation remodeling process committed to TSC formation. We further identified 1,293 CpG islands (CGIs) whose DNA methylation difference is more than 0.25 during NF TSC derivation. The majority of these CGIs become highly methylated upon FGF4 treatment and remain in high levels. This may create a barrier for lineage commitment to restrict embryonic development, and ensure TSC formation. There exist hundreds of aberrantly methylated CGIs during NT TSC derivation, most of which are corrected during SNT TSC derivation. More than half of the aberrantly methylated CGIs before NT TSC formation are inherited from the donor genome. In contrast, the aberrantly methylated CGIs upon TSC formation are mainly from the highly methylated CGIs induced by FGF4 treatment. Functional annotation indicates that the aberrantly highly methylated CGIs play a role in repressing placenta development genes, etc., related to post-implantation development and maintaining TSC pluripotency. Collectively, our findings provide novel insights into the transcription dynamics, DNA methylation remodeling, and the role of FGF4 during TSC derivation.

Keywords: DNA methylation; Scriptaid; somatic cell nuclear transfer; transcriptome; trophoblast stem cell.


Conflict of interest statement

The authors declare that the research was conducted in the absence of any commercial or financial relationships that could be construed as a potential conflict of interest.

Figures
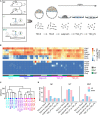
FIGURE 1
FIGURE 1
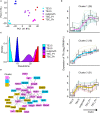
Trophoblast stem cell (TSC) derivation and profiling of the transcriptomes. (A) Schematic diagram for TSC derivation from natural fertilization (NF), nuclear transfer (NT), and Scriptaid-treated NT (SNT) blastocysts, which NF represents the embryos from natural fertilization; NT, somatic cell nuclear transfer; SNT, NT with histone deacetylase (HDAC) inhibitor (Scriptaid) treatment. TSC_P1: TSC formation (passage 1). TSC_Pn are TSCs cultured for three to four passages (see section “Materials and Methods” for details). (B) A heat map showing the normalized expression of pluripotency genes (top), and differentiation genes (bottom). Of note, the marker genes for the different trophoblast subtypes are Gcm1, labyrinthine trophoblast marker; Tpbpa, spongiotrophoblast marker; Prl3b1, giant cell marker. (C) A dendrogram showing clustering of gene expressions of all samples. The replicates of each sample are merged using the mean values. (D) The statistics of the differentially expressed genes (DEGs) between adjacent stages during TSC derivation. Red, upregulated DEGs; blue, downregulated DEGs.
FIGURE 2
FIGURE 2
The key transcription factors critical to the derivation of NF TSCs. (A) Principal component analysis (PCA) of the transcriptomic data of NF samples. (B) Expression patterns of the 75 transcription factors in Clusters 1–3 (Supplementary Figure 2B). (C) The pseudotime of NF TSC derivation inferred from the transcriptomes of the 75 transcription factors (TFs) in (B). (D) Protein–protein interaction (PPI) networks of the 75 TFs in (B). The thickness of the lines represents the PPI scores, and the color represents the gene cluster in Supplementary Figure 2B.
FIGURE 3
FIGURE 3
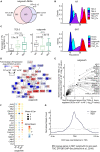
Downregulated genes in NT outgrowth are largely rescued in SNT outgrowth. (A) Venn diagrams showing the intersection between the downregulated genes in NT outgrowth compared with NF outgrowth and the upregulated gene SNT outgrowth compared with NT outgrowth. Representation factor (RF) was calculated using real observation/expected observation. The statistical analysis is hypergeometric test with all expressed genes at outgrowth as background. The intersection genes are defined as the rescued genes. (B) The pseudotime of NT (top) or SNT (bottom) TSC derivation inferred from the transcriptomes of the 75 TFs in Clusters 1–3 (Supplementary Figure 3D). (C) Boxplots showing the expression of the 75 TFs in Clusters 1–3. Paired t-test is performed for statistical comparisons, and “holm” is used for adjusting p-values. (D) Expression changes of the component TFs in the PPI network (Figure 2D) in NT outgrowth are recued in SNT outgrowth. Each box is divided into two parts. Left part represents the expression difference between NT and NF outgrowth. Right part represents the expression difference between SNT and NF outgrowth. Color scale bar indicates the fold change of gene expression between NT/SNT and NF in the form of Log2. Red indicates increased expression. Blue indicates decreased expression. (E) Scatterplot showing the significance of the motif enrichment in the proximal TSS regions of the two gene sets in (A). (F) Bubble plot showing gene expressions of the TFs whose motifs are identified in (E). The size of the bubble indicates the mean gene expression at NF, NT, and SNT outgrowths. The color indicates the difference from the mean. (G) ZFP281 ChIP-seq signal distribution around transcript start sites (TSSs) in the rescued genes [the intersection part in (A)]. TSC ZFP281 ChIP-seq data is from GSE111824 (Ishiuchi et al., 2019). The dark blue line indicates ZFP281 ChIP-seq data, while the gray line indicates the input signal.
FIGURE 4
FIGURE 4
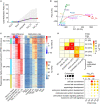
Fibroblast growth factor 4 (FGF4) functions in methylation remodeling during TSC derivation. (A) CpG methylation levels at each stage of TSC derivation. The line indicates the medians. The shaded area represents the 25th to 75th percentiles. (B) Principal component analysis (PCA) of CpG island (CGI) methylation. The reduced representation bisulfite sequencing (RRBS) data of perturbingly cultured inner cell mass (ICM) are from GSE98963 (Smith et al., 2017). FGF4/WNT.in and FGF4/WNT.out represent the internal and outer part of the outgrowth derived from ICM cultured in the basal media supplemented with FGF4 and WNT agonist CHIR99021, respectively. FGF4 and CHIR99021 do not reach FGF4/WNT.in; FGF4/WNT.out, the outer layer of the outgrowth, responded to FGF4 and CHIR99021. PD represents ICM cultured in the basal media supplemented with MAPKK or MEK inhibitor PD0325901 and FGF4. The RRBS data of ESCs are from GSE47343 (Guo et al., 2013). (C) Heat maps showing K-mean clustering of the PHIM-CGIs during TSC derivation, whose DNA methylation level difference between adjacent stages is larger than 25%. Left heatmap showing CGI DNA methylation level difference between adjacent stages. Right heatmap showing CGI DNA methylation levels in each sample. (D) A heat map showing the intersection between the PHIM-CGIs (C) and the highly methylated CGIs (>0.25). Filled colors indicate the significance of the intersection (hypergeometric test). Numbers indicate CGI count. “EXE/EPI-com” denotes the CGIs that are highly methylated in both EXE and EPI. “EXE-specific” and “EPI-specific” denote the CGIs that are highly methylated specifically in EXE and EPI, respectively. “FGF4.out-sp” denotes the CGIs that are highly methylated in ICM treated with FGF4 but not in EXE and EPI. “FGF4/WNT.out-sp” denotes the CGIs that are highly methylated in outgrowth outer layers derived from ICM treated with FGF4 and WNT agonist CHIR99021 but not in EXE and EPI. (E) Bubble plots showing the gene ontology (GO) terms significantly enriched in the PHIM-CGIs (C).
FIGURE 5
FIGURE 5
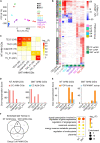
Abnormal methylation in the donor genome is a barrier to methylation remodeling during NT TSC derivation. (A) PCA results of CGI methylation during NF, NT, and SNT TSC derivation. CC (cumulus cell), MII oocyte, and sperm are also included for comparison. Their methylation data are from GSE56697 (Wang et al., 2014). (B) A heat map showing methylation difference of aberrantly highly methylated (AHM)- and aberrantly lowly methylated (ALM)-CGIs (Definitions are in section “Results”). (C) A heat map showing the intersection between NT and SNT AHM-CGIs. Filled colors indicate the significance of the intersection (hypergeometric test). Numbers indicate CGI count. (D) CC AHM-CGIs are enriched in early stages (TE3.5, TE4.5, and outgrowth) of NT/SNT TSC derivation. (E) “FGF4.out-sp” CGIs are specifically enriched in AHM-CGIs of NT and SNT TSC_P1, and TSC_Pn. “FGF4.out-sp” denotes the CGIs that are highly methylated in ICM treated with FGF4 but not in EXE and EPI. (F) Venn diagram showing the intersection the GO terms for which NT/SNT AHM-CGIs and the Group 5 of PHIM-CGIs (Figure 4C) are significantly enriched. The numbers indicate GO term count. The bubble plot showing the six GO terms specifically common to the GO terms for which NT/SNT AHM-CGIs are significantly enriched.

Similar articles

Cited by

References

    1. Adachi K., Nikaido I., Ohta H., Ohtsuka S., Ura H., Kadota M., et al. (2013). Context-dependent wiring of sox2 regulatory networks for self-renewal of embryonic and trophoblast stem cells. Mol. Cell 52 380–392. 10.1016/j.molcel.2013.09.002 - DOI - PubMed
    1. Beerman I., Bock C., Garrison B. S., Smith Z. D., Gu H., Meissner A., et al. (2013). Proliferation-dependent alterations of the DNA methylation landscape underlie hematopoietic stem cell aging. Cell Stem Cell 12 413–425. 10.1016/j.stem.2013.01.017 - DOI - PubMed
    1. Branco M. R., King M., Perez-Garcia V., Bogutz A. B., Caley M., Fineberg E., et al. (2016). Maternal DNA methylation regulates early trophoblast development. Dev. Cell 36 152–163. 10.1016/j.devcel.2015.12.027 - DOI - PMC - PubMed
    1. Chen M., Zhu Q., Li C., Kou X., Zhao Y., Li Y., et al. (2020). Chromatin architecture reorganization in murine somatic cell nuclear transfer embryos. Nat. Commun. 11:1813. 10.1038/s41467-020-15607-z - DOI - PMC - PubMed
    1. Chung Y. G., Matoba S., Liu Y., Eum J. H., Lu F., Jiang W., et al. (2015). Histone demethylase expression enhances human somatic cell nuclear transfer efficiency and promotes derivation of pluripotent stem cells. Cell Stem Cell 17 758–766. 10.1016/j.stem.2015.10.001 - DOI - PubMed
  NODES
INTERN 1
Note 6
Project 1
twitter 2