. 2021 May;37(5):597-610.
doi: 10.1007/s12264-021-00668-x. Epub 2021 Apr 26.

KCNQ Channels in the Mesolimbic Reward Circuit Regulate Nociception in Chronic Pain in Mice

Affiliations

KCNQ Channels in the Mesolimbic Reward Circuit Regulate Nociception in Chronic Pain in Mice

Hao-Ran Wang et al. Neurosci Bull. 2021 May.

Abstract

Mesocorticolimbic dopaminergic (DA) neurons have been implicated in regulating nociception in chronic pain, yet the mechanisms are barely understood. Here, we found that chronic constructive injury (CCI) in mice increased the firing activity and decreased the KCNQ channel-mediated M-currents in ventral tegmental area (VTA) DA neurons projecting to the nucleus accumbens (NAc). Chemogenetic inhibition of the VTA-to-NAc DA neurons alleviated CCI-induced thermal nociception. Opposite changes in the firing activity and M-currents were recorded in VTA DA neurons projecting to the medial prefrontal cortex (mPFC) but did not affect nociception. In addition, intra-VTA injection of retigabine, a KCNQ opener, while reversing the changes of the VTA-to-NAc DA neurons, alleviated CCI-induced nociception, and this was abolished by injecting exogenous BDNF into the NAc. Taken together, these findings highlight a vital role of KCNQ channel-mediated modulation of mesolimbic DA activity in regulating thermal nociception in the chronic pain state.

Keywords: Brain-derived neurotrophic factor; Chronic neuropathic pain; KCNQ; Mesocorticolimbic system; Nociception; Retigabine; Ventral tegmental area.


Conflict of interest statement

The authors declare no competing interests.

Figures

Fig. 1
Fig. 1
CCI induces different changes in the firing rates of VTA-to-NAc and VTA-to-mPFC DA neurons. A Experimental timeline. B Summary results showing that PWLs are lower on day 3, 7, and 14 after CCI surgery than in sham mice (n = 7 mice/group; ***P <0.001, two-way ANOVA with repeated measures and Bonferroni’s post-test). C Schematic of retrograde lumafluor injection into the NAc or mPFC and labeling lumafluor in the VTA (scale bar, 50 μm). D Sample traces and statistics of cell-attached recordings showing that CCI induces an increase in the firing rates of contralateral VTA-to-NAc DA neurons (n = 9–12 cells/3–4 mice/group; ***P <0.001 vs sham-contra and CCI-ipsi groups, one-way ANOVA with Tukey’s post-test). E Sample traces and statistics of cell-attached recordings showing that CCI induces a decrease in the firing rates of contralateral VTA-to-mPFC DA neurons (n = 10–22 cells/3–5 mice/group; *P <0.05 vs sham-contra and CCI-ipsi groups, one-way ANOVA with Tukey’s post-test). Error bars show mean and SEM.
Fig. 2
Fig. 2
The VTA-to-NAc, but not the VTA-to-mPFC DA circuit, regulates thermal nociception in CCI mice. A Experimental timeline. B Schematic of viral injections of retrograde rAAV-TH-NLS-Cre-WAPE-pA into the NAc and cre-dependent rAAV-Eflα-DIO-hM4D(Gi)-mCherry-WPRE-pA into the VTA; representative confocal image showing co-expression of hM4Di expression (red) in VTA DA neurons (green) (scale bar, 200 μm). C Sample traces and statistics from VTA slices showing that the firing activity of putative VTA-to-NAc DA neurons are inhibited by CNO perfusion (n = 11 cells from 6 mice; ***P <0.001, paired t test). D Summary data showing that CCI mice with CNO injection exhibit alleviated nociceptive responses compared to mice with saline injection (n = 8–9 mice/group; ***P <0.001 vs pre-CNO injection and CCI+Sal groups, two-way ANOVA with repeated measures and Bonferroni’s post-test). E Schematic of viral injections of a retrograde rAAV-TH-NLS-Cre-WAPE-pA into the mPFC and cre-dependent rAAV-Eflα-DIO-hM3D(Gq)-mCherry-WPRE-pA into the VTA; representative confocal image showing co-expression of hM3Dq expression (red) in VTA DA neurons (green) (scale bar, 200 μm). F Sample traces and statistics from VTA slices showing that the firing of putative VTA-to-mPFC DA neurons is increased by CNO perfusion (n = 16 cells from 6 mice; ****P <0.0001, Wilcoxon test). G Summary data showing that CNO injection does not change the PWLs of CCI mice (n = 6–8 mice/group; two-way ANOVA with repeated measures and Bonferroni’s post-test). Error bars show the mean and SEM.
Fig. 3
Fig. 3
CCI induces different changes in the IM of VTA-to-NAc and VTA-to-mPFC DA neurons. A Sample traces and statistics from VTA-to-NAc DA neurons showing decreased M-current density in CCI mice (n = 11 cells/3–4 mice/group; **P <0.01, unpaired t test). B Sample traces and statistics from VTA-to-mPFC DA neurons showing increased M-currents in CCI mice (n = 11–15 cells/3–5 mice/group; **P <0.01 vs sham group, unpaired t test).
Fig. 4
Fig. 4
Location of KCNQ2 and KCNQ3 in VTA-to-NAc and VTA-to-mPFC DA neurons. A Confocal images showing the expression of KCNQ2 (red) in putative VTA-to-NAc DA neurons (blue and green) (scale bar, 50 μm). B Confocal images showing the expression of KCNQ2 (red) in the putative VTA-to-mPFC DA neurons (blue and green) (scale bar, 50 μm). C Statistics for the percentage of KCNQ2-positive cells in putative VTA-to-NAc DA neurons; the sham and CCI mice did not differ (2–3 sections/mouse from 3 mice; unpaired t test). D Statistics for the percentage of KCNQ2-positive cells in putative VTA-to-mPFC DA neurons; the sham and CCI mice did not differ (2–3 sections/mouse from 3 mice; unpaired t test). E Confocal images showing the expression of KCNQ3 (red) in putative VTA-to-NAc DA neurons (blue and green) (scale bar, 50 μm). F Confocal images showing the expression of KCNQ3 (red) in putative VTA-to-mPFC DA neurons (blue and green) (scale bar, 50 μm). G Statistics for the percentage of KCNQ3-positive cells in putative VTA-to-NAc DA neurons; the sham and CCI mice did not differ (2–3 sections/mouse from 3 mice; unpaired t test). H Statistics for the percentage of KCNQ3-positive cells in putative VTA-to-mPFC DA neurons; the sham and CCI mice did not differ (2–3 sections/mouse from 3 mice; unpaired t test). Error bars show the mean and SEM.
Fig. 5
Fig. 5
KCNQ2 overexpression in the VTA-to-NAc, but not the VTA-to-mPFC DA neurons relieves thermal nociception in CCI mice. A Experimental timeline. B Schematic of viral injections of a retrograde rAAV-TH-NLS-Cre-WAPE-pA into the NAc, and a cre-dependent rAAV-CMV-DIO-KCNQ2-EGFP-WPRE-pA into the VTA; representative confocal image showing KCNQ2-EGFP expression (green) in the VTA (scale bar, 100 μm). C Sample traces and statistics from VTA-to-NAc DA neurons showing increased M-current density in CCI mice with KCNQ2 overexpression in VTA-to-NAc DA neurons (n = 10–22 cells/3–5 mice/group; *P <0.05, unpaired t test). D Sample traces and summary showing that the firing rate of VTA-to-NAc DA neurons was decreased in CCI mice with KCNQ2 overexpression in these neurons (n = 10–22 cells/3–5 mice/group; ***P <0.001, unpaired t test). E Summary showing PWLs are increased after KCNQ2 overexpression in VTA-to-NAc DA neurons (n = 8 mice/group; ***P <0.001, unpaired t test). F Schematic of viral injections of retrograde rAAV-TH-NLS-Cre-WAPE-pA into the mPFC, and cre-dependent rAAV-CMV-DIO-KCNQ2-EGFP-WPRE-pA into the VTA; representative confocal image showing KCNQ2-EGFP expression (green) in the VTA (scale bar, 100 μm). G Summary data showing that KCNQ2 overexpression in the VTA-to-mPFC DA neurons does not change the PWLs in CCI mice (n = 8 mice/group; unpaired t test). Error bars show the mean and SEM.
Fig. 6
Fig. 6
Intra-VTA injection of retigabine reduces nociceptive responses in CCI mice. AC Sample traces (A) and quantitative data (B, C) showing that retigabine increases the M-current density and membrane potential in VTA-to-NAc DA neurons (n = 12–16 cells/3–4 mice/group; **P <0.01, unpaired t test). DF Sample traces (D) and quantitative data (E, F) showing that retigabine increase the M-current density and membrane potential in VTA-to-mPFC DA neurons (n = 12–16 cells/3–4 mice/group, *P <0.05, **P <0.01, unpaired t test). G Sample traces and statistics from whole-cell recordings (100 pA current injection) showing decreased activity of VTA-to-NAc DA neurons (n = 6 cells/3 mice/group; **P <0.01, unpaired t test). H Sample traces and statistics from whole-cell recordings (100 pA current injection) showing decreased activity of VTA-to-mPFC DA neurons (n = 6 cells/3 mice/group; **P <0.01, unpaired t test). I Summary data showing that intra-VTA injection of retigabine increases PWLs in CCI mice (n = 6 mice/group; ***P <0.001, **P <0.01 vs CCI+Sal group, two-way ANOVA with repeated measures and Bonferroni’s post-test). Error bars show the mean and SEM.
Fig. 7
Fig. 7
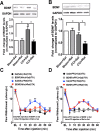
BDNF signaling in the VTA-to-NAc DA circuit is involved in the anti-nociceptive effect of retigabine. A Typical bands and summary showing upregulated BDNF protein levels in the NAc of CCI mice (n = 3; *P <0.05 vs sham+Sal group, one-way ANOVA with Tukey’s post-test); this was reversed by retigabine injection into the VTA (n = 3; *P <0.05 vs CCI+Sal group, one-way ANOVA with Tukey’s post-test). B Typical bands and summary showing downregulated BDNF protein levels in the mPFC of CCI mice (n = 3; *P <0.05 vs sham+Sal group, one-way ANOVA with Tukey’s post-test); this was further reduced by retigabine injection into the VTA (n = 3; *P <0.05 vs CCI+Sal group, one-way ANOVA with Tukey’s post-test). C Summary data showing that intra-NAc injection of exogenous BDNF abolishes the anti-nociceptive effect of intra-VTA retigabine injection in CCI mice (n = 6 mice/group; **P <0.01 vs Sal (NAc) + Ret (VTA) group, two-way ANOVA with repeated measures and Bonferroni’s post-test). D Summary data showing that intra-mPFC injection of exogenous BDNF does not alter the anti-nociceptive effect of retigabine in CCI mice (n = 6 mice/group; two-way ANOVA with repeated measures and Bonferroni’s post-test). Error bars show the mean and SEM.

Similar articles

Cited by

References

    1. Baliki MN, Apkarian AV. Nociception, pain, negative moods, and behavior selection. Neuron. 2015;87:474–491. doi: 10.1016/j.neuron.2015.06.005. - DOI - PMC - PubMed
    1. Murray CJ, Lopez AD. Measuring the global burden of disease. N Engl J Med. 2013;369:448–457. doi: 10.1056/NEJMra1201534. - DOI - PubMed
    1. Mitsi V, Zachariou V. Modulation of pain, nociception, and analgesia by the brain reward center. Neuroscience. 2016;338:81–92. doi: 10.1016/j.neuroscience.2016.05.017. - DOI - PMC - PubMed
    1. Navratilova E, Atcherley CW, Porreca F. Brain circuits encoding reward from pain relief. Trends Neurosci. 2015;38:741–750. doi: 10.1016/j.tins.2015.09.003. - DOI - PMC - PubMed
    1. Navratilova E, Porreca F. Reward and motivation in pain and pain relief. Nat Neurosci. 2014;17:1304–1312. doi: 10.1038/nn.3811. - DOI - PMC - PubMed
  NODES
Project 4
twitter 2