. 2021 Jun 4;49(10):5637-5653.
doi: 10.1093/nar/gkab401.

TbTRF suppresses the TERRA level and regulates the cell cycle-dependent TERRA foci number with a TERRA binding activity in its C-terminal Myb domain

Affiliations

TbTRF suppresses the TERRA level and regulates the cell cycle-dependent TERRA foci number with a TERRA binding activity in its C-terminal Myb domain

Arpita Saha et al. Nucleic Acids Res. .

Abstract

Telomere repeat-containing RNA (TERRA) has been identified in multiple organisms including Trypanosoma brucei, a protozoan parasite that causes human African trypanosomiasis. T. brucei regularly switches its major surface antigen, VSG, to evade the host immune response. VSG is expressed exclusively from subtelomeric expression sites, and we have shown that telomere proteins play important roles in the regulation of VSG silencing and switching. In this study, we identify several unique features of TERRA and telomere biology in T. brucei. First, the number of TERRA foci is cell cycle-regulated and influenced by TbTRF, the duplex telomere DNA binding factor in T. brucei. Second, TERRA is transcribed by RNA polymerase I mainly from a single telomere downstream of the active VSG. Third, TbTRF binds TERRA through its C-terminal Myb domain, which also has the duplex DNA binding activity, in a sequence-specific manner and suppresses the TERRA level without affecting its half-life. Finally, levels of the telomeric R-loop and telomere DNA damage were increased upon TbTRF depletion. Overexpression of an ectopic allele of RNase H1 that resolves the R-loop structure in TbTRF RNAi cells can partially suppress these phenotypes, revealing an underlying mechanism of how TbTRF helps maintain telomere integrity.


Figures

Figure 1.
Figure 1.
The number of nuclear TERRA foci increases as cells progress through the cell cycle. (A) Examples of WT cells with various numbers of TERRA foci at different cell cycle stages. TERRA was stained by a TelC-Alexa488 PNA probe (PNA Bio). DNA was stained by DAPI. All images are of the same scale, and a size bar is shown in one of the images in each panel. (B) Quantification of percent of WT cells with different numbers of nuclear TERRA foci at various cell cycle stages. A total of 310 G1, 403 S, and 253 G2/M nuclei were counted. Red asterisks mark significant differences when S or G2/M cells are compared to G1 cells. In this and other figures, error bars represent standard deviation. Unpaired t-tests were performed, and a significance threshold of p < 0.05 was set for the null hypothesis. (C) Examples of WT post-mitotic cells (2N2K) with 1–2 TERRA foci per nucleus. Examples of 2N2K cells with more nuclear TERRA foci can be found in Supplementary Figure S1D. VSG2 was stained to outline the cell surface and ensure the cells are at the post mitotic phase (each cell has 2N2K). Images of the same cells with (left) or without (right) the VSG2 staining are shown. (D) Quantification of percent of different types of WT post-mitotic cells. Different types of 2N2K cells are listed in the table at the bottom. A total of 240 cells were counted. (E) The brightest TERRA focus colocalizes with TbTRF. TbTRF is stained with a rabbit antibody (41). (F) Quantification of percent of TbTRF RNAi cells with different numbers of nuclear TERRA foci at various cell cycle stages after 24 hrs of RNAi induction. A total of 130–230 cells were counted at each cell cycle stage. Red asterisks mark significant differences between WT and TbTRF RNAi cells at each corresponding cell cycle stage. Green asterisks mark significant differences when S or G2/M cells are compared to G1 cells. (G) Examples of TERRA foci in TbTRF-depleted cells at various cell cycle stages.
Figure 2.
Figure 2.
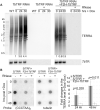
Depletion of TbTRF results in a higher TERRA level. (A) Northern analysis of TERRA in TbTRF RNAi cells with or without a complementary F2H-TbTRF allele. Total RNA was isolated from cells after the induction for 0, 24, and 30 hrs. Equal amounts of RNA samples were treated with or without RNase A and RNase One. TbTR was detected as a loading control. The relative TERRA levels (after normalization against the TbTR level) were quantified and indicated at the bottom of the blot. Asterisks represent rRNA precursors as non-specific hybridization signals. (B) A representative TERRA slot blot of samples from S/TRFi cells (TbTRF RNAi in the strain used for VSG switching analysis (44)) with or without a complementary F2H-TbTRF allele. Total RNA was isolated from cells after the induction for 0, 24 and 48 hrs. Equal amounts of RNA samples were treated with or without RNase A and RNase One. Tubulin was detected as a loading control. Average signal intensities were calculated from three slot blot analyses and are shown on the right. P-values of unpaired t-tests are shown.
Figure 3.
Figure 3.
TERRA is transcribed from the active VSG-adjacent telomere in WT and TbTRF-depleted cells. (A) Total RNA was purified from the VSG2-expressing S/TRFi cells before (top) and after (bottom) induction for 24 hrs and reverse-transcribed using TELC20, TELG20, a random hexamer (as a positive control), or ddH2O (as a negative control) as the RT primer (labeled beneath each gel). The RT products were PCR amplified using primers specific to VSG2 (active), VSG3 (silent), VSG9 (silent), 70 bp repeats, tubulin, and rRNA (marked on top of each lane), and the PCR products were separated on agarose gels. (B) Total RNA was purified from the VSG2-expressing TbTRF RNAi cells before (left) and after (right) induction for 24 hrs and reverse-transcribed using TELC20, TELG20, and a random hexamer (as a positive control) as the RT primer (labeled beneath each gel). The RT products were PCR amplified using primers specific to VSG2 (active), VSG3 (silent), tubulin, and a subtelomeric locus on chromosome 11 (Chr11sub) (marked on top of each lane), and the PCR products were separated on agarose gels. (C) TERRA is sensitive to BMH-21, an RNAP I inhibitor. Left, a representative TERRA slot blot of samples from TbTRF RNAi cells before and 24 hrs after the induction of TbTRF RNAi with and without the BMH-21 treatment. TbTR was detected as a control. Right, quantification of relative TERRA levels in TbTRF RNAi cells treated with and without 3 μM BMH-21 for 3 hrs. Average was calculated from four slot blots. (D) representative images of nuclear TERRA foci in TbTRF RNAi cells treated with and without BMH-21 for 3 hrs.
Figure 4.
Figure 4.
TbTRF suppresses TERRA transcription mildly but does not affect its half-life. (A) The level of TERRA was estimated by northern slot blot after cells were treated with Actinomycin D for various lengths of time (left). TERRA hybridization signals were quantified by ImageQuant (right). Average values were calculated from four independent experiments. TbTR was detected as a loading control. In TbTRF RNAi cells, the TERRA level was estimated before (-Dox) and 24 hrs after induction of TbTRF RNAi (+Dox). (B) The level of the VSG2-TERRA-containing RNA increased mildly in TbTRF-depleted cells. Reverse transcription was performed using TELC20 (TERRA) and a hexamer containing a random sequence (VSG2) followed by qPCR using the VSG2-specific primers. The average fold changes in the RNA level were calculated from three to five independent experiments. (C) Metacyclic ES-linked VSGs were mildly derepressed in TbTRF-depleted cells. qRT-PCR was performed to estimate the relative RNA levels of various BF ES- and metacyclic ES-linked VSGs. TbTERT mRNA level was estimated as a control. Changes in mVSG397, mVSG531, and mVSG653 RNA levels are significantly higher (asterisks) than that in the TbTERT RNA level.
Figure 5.
Figure 5.
Depletion of TbTRF leads to more telomeric R-loops and an increased amount of DNA damage at the telomere. (A, I) A representative Southern slot blot of input, IgG and S9.6 immunoprecipitated DNA samples in TbTRF+/– RNAi (A) and TbTRF+/– RNAi+2HA-RNase H1 (I) cells before (-Dox) and after (+Dox) adding doxycycline for 24 hrs. Samples were treated with or without RNase H (ThermoFisher) before IP. A (TTAGGG)n probe was used in the hybridization. (B) Quantification of the slot blot hybridization signals in both TbTRF+/– RNAi and TbTRF+/– RNAi+2HA-RNase H1 cells. Enrichment of the telomeric R-loop (over input) was calculated before and after adding doxycycline and the fold changes in this enrichment were plotted for both cells. Average values were calculated from four to five independent experiments. (C) Western analyses using the HA antibody (HA probe, Santa Cruz Biotechnologies), a TbTRF rabbit antibody (41), a γH2A rabbit antibody (9), and the tubulin antibody TAT-1 (86) in WT, TbTRF+/– RNAi and TbTRF+/– RNAi+2HA-RNase H1 cells. (D) Quantification of γH2A IF results. A majority of cells were positive for the γH2A staining after TbTRF was depleted. (E) ChIP using the γH2A antibody and IgG (as a negative control) were performed in TbTRF RNAi cells before and 24 hrs after the induction of RNAi. ChIP products were analyzed by slot blot hybridization with a telomere probe. (F) Quantification of three independent γH2A ChIP results in TbTRF RNAi cells. Averages of telomeric DNA enrichment in the ChIP experiments were calculated. (G) ChIP using the γH2A antibody and IgG were performed in TbTRF+/– RNAi and TbTRF+/– RNAi+2HA-RNase H1 cells before and 24 hrs after adding doxycycline. ChIP products were detected by Southern hybridization using a telomere probe. (H) Quantification of three independent γH2A ChIP results in TbTRF+/– RNAi and TbTRF+/– RNAi+2HA-RNase H1 cells. Enrichment of γH2A at the telomere (over input) was calculated before and after adding doxycycline and the fold changes in this enrichment were plotted for both cells. In (B), (F) and (H), p-values of unpaired t-test are shown.
Figure 6.
Figure 6.
(A) TbTRF binds to single stranded UUAGGG repeats directly. EMSA was performed using the recombinant GST-tagged TbTRF2-382 (numbers indicate aa positions) expressed from E.coli (41) and ss(UUAGGG)12 or ss(CCCUAA)12 as the probe. Non-radiolabeled (UUAGGG)12 was added as a competitor. The amount of TbTRF (ng) used is indicated on top of each lane. (BC) TbTRF associates with TERRA in vivo. Cell lysates were incubated with TbTRF antibody (41) (B) or a rabbit anti-GFP antibody (ThermoFisher) (C). RNA was isolated from the IP products and analyzed by slot blot hybridization with a (CCCTAA)n-containing probe. A representative slot blot is shown at the top. Hybridization with an rRNA probe is used as a negative control in (B). The average enrichment of the RNA-IP product was calculated from three slot blot hybridizations and is shown at the bottom. P values of unpaired t-tests are shown in (B) and (C).
Figure 7.
Figure 7.
The TbTRF Myb domain has a TERRA binding activity. EMSA was performed using the recombinant GST-tagged TbTRF fragments containing aa 297–357 (A), aa 280–382 (A), aa 280–382 with the R298E mutation (B, C), aa 2–161 (D), aa 163–296 (D), and aa 2–382 (D–G) expressed from E. coli and ss(UUAGGG)12, ss(CCCUAA)12, or ds(TTAGGG)12 as the probe. The amount (ng) of recombinant proteins used in EMSA are indicated on top of each lane. Non-radiolabeled (UUAGGG)12 and ds(TTAGGG)12 were used as competitors in (E–G). Amounts of competitors are shown as molar folds of the radiolabeled probe. Asterisks indicate the positions of free probes. (H) Quantification of EMSA results shown in (E), (F) and (G). The remaining protein-probe complex in the presence of various amounts of the competitor is calculated as the percent of the complex amount in the absence of any competitor.

Similar articles

Cited by

References

    1. de Lange T. Shelterin-mediated telomere protection. Annu. Rev. Genet. 2018; 52:223–247. - PubMed
    1. Ottaviani A., Gilson E., Magdinier F.. Telomeric position effect: from the yeast paradigm to human pathologies. Biochimie. 2008; 90:93–107. - PubMed
    1. Saha A., Nanavaty V.P., Li B.. Telomere and subtelomere R-loops and antigenic variation in trypanosomes. J. Mol. Biol. 2019; 432:4167–4185. - PMC - PubMed
    1. Nergadze S.G., Farnung B.O., Wischnewski H., Khoriauli L., Vitelli V., Chawla R., Giulotto E., Azzalin C.M.. CpG-island promoters drive transcription of human telomeres. RNA. 2009; 15:2186–2194. - PMC - PubMed
    1. Chu H.P., Froberg J.E., Kesner B., Oh H.J., Ji F., Sadreyev R., Pinter S.F., Lee J.T.. PAR-TERRA directs homologous sex chromosome pairing. Nat. Struct. Mol. Biol. 2017; 24:620–631. - PMC - PubMed

Publication types

MeSH terms

Substances

LinkOut - more resources

  NODES
twitter 2