. 2021 Jun 9;12(1):3500.
doi: 10.1038/s41467-021-23864-9.

WSX1 act as a tumor suppressor in hepatocellular carcinoma by downregulating neoplastic PD-L1 expression

Affiliations

WSX1 act as a tumor suppressor in hepatocellular carcinoma by downregulating neoplastic PD-L1 expression

Man Wu et al. Nat Commun. .

Abstract

WSX1, a receptor subunit for IL-27, is widely expressed in immune cells and closely involved in immune response, but its function in nonimmune cells remains unknown. Here we report that WSX1 is highly expressed in human hepatocytes but downregulated in hepatocellular carcinoma (HCC) cells. Using NRAS/AKT-derived spontaneous HCC mouse models, we reveal an IL-27-independent tumor-suppressive effect of WSX1 that largely relies on CD8+ T-cell immune surveillance via reducing neoplastic PD-L1 expression and the associated CD8+ T-cell exhaustion. Mechanistically, WSX1 transcriptionally downregulates an isoform of PI3K-PI3Kδ and thereby inactivates AKT, reducing AKT-induced GSK3β inhibition. Activated GSK3β then boosts PD-L1 degradation, resulting in PD-L1 reduction. Overall, we demonstrate that WSX1 is a tumor suppressor that reinforces hepatic immune surveillance by blocking the PI3Kδ/AKT/GSK3β/PD-L1 pathway. Our results may yield insights into the host homeostatic control of immune response and benefit the development of cancer immunotherapies.


Conflict of interest statement

The authors declare no competing interests.

Figures

Fig. 1
Fig. 1. WSX1 is highly expressed in normal hepatocytes, and its downregulation in HCC correlated with poor prognosis.
a Immunohistochemical (IHC) staining of WSX1 in a human normal tissue microarray (TMA, FDA662a). The images shown are representatives for results of 2 individuals. b IHC staining of WSX1 in HCC TMAs (BC03116a and HLiv-HCC180Sur-03), including human normal liver tissue (n = 17), NAT (n = 103, P < 0.0001 compared to normal liver tissue), and HCC (n = 130, P < 0.0001 compared to both normal liver tissue and NAT) samples. Statistical analysis results are based on quantification of the percentage of WSX1+ area in each TMA tissue core. c Comparisons of the overall survival of HCC patients between low (n = 47) and high WSX1 expression group (n = 43, P = 0.0034). Forty HCC patients in TMA BC03116a were excluded due to lack of survival data. d WSX1 expression levels among different tumor pathological grades in HCC patients, including NAT (n = 103), grade I (n = 21), grade II (n = 73, P = 0.0321 compared to grade I) and grade III (n = 34, P < 0.0001 compared to grade I and P = 0.0123 compared to gradeII). Quantification and statistical analysis results are shown on the right. Scale bars, 50 μm. Quantitative data are presented as mean ± SD. One-way ANOVA was used to calculate the P values. Tukey-Kramer multiple comparison test was used for pairwise comparisons in the ANOVA analysis. The survival curves were analyzed by the Kaplan–Meier method, and the log-rank test was used to compare overall survival between groups. All statistical tests were two-sided. *P < 0.05, **P < 0.01, ****P < 0.0001. HCC hepatocellular carcinoma, NAT normal tumor-adjacent liver tissue. Source data are provided as a Source Data file.
Fig. 2
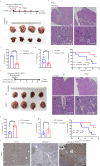
Fig. 2. WSX1 retards oncogenic NRAS/AKT-induced HCC development in vivo.
a (Top) Summary of NRAS/AKT oncogene-derived spontaneous HCC mouse model in FVB/NJ mice (n = 8). Arrowheads represent hydrodynamic injection of WSX1 every week. (Bottom) Representative images of entire mouse livers in the oncogene and oncogene + WSX1 groups. b Comparisons of hematoxylin and eosin (H&E) histology. c Comparisons of percentage of liver area containing preneoplastic/tumor lesions based on H&E results (P < 0.0001). d Difference in liver weight between oncogene and oncogene + WSX1 groups (P = 0.0088). e Comparison of overall survival (P = 0.0217). f (Top) Summary of HCC mouse model in wild-type or WSX1−/− C57BL/6J mice (n = 6). (Bottom) Representative images of entire mouse livers in wild-type or WSX1−/− mice. g Comparisons of H&E histology. h Comparisons of percentage of liver area containing preneoplastic/tumor lesions (P = 0.0012). i Difference in liver weight between wild-type or WSX1−/− mice (P = 0.0328). j Comparisons of overall survival (P = 0.0252). k Expression of WSX1 in mouse liver tissues in the vector, oncogene, and oncogene + WSX1 groups. Scale bars, 100 μm. All data and images are representative of 3 independent experiments. Quantitative data are presented as mean ± SD and analyzed by two-sided Student t test. The survival curves were analyzed by the Kaplan–Meier method, and the log-rank test was used to compare overall survival between groups. *P < 0.05, **P < 0.01, ****P < 0.0001. Source data are provided as a Source Data file.
Fig. 3
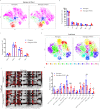
Fig. 3. WSX1 inhibits HCC development by relieving T-cell exhaustion.
a t-distributed stochastic neighbor embedding (t-SNE) map derived from time-of-flight mass cytometry (CyTOF) analysis of intrahepatic immune cells obtained from the HCC mouse model in Fig. 2a (n = 4). Cells are colored by clusters identified by Rphenograph. Clusters were grouped by expression profile and manually assigned to 6 main cell subsets: T cells, B cells, NK cells, Mϕ, DCs, and other CD3 cells. b The percentage of T, B, NK, Mϕ, DC, and other CD3 cells among all intrahepatic immune cells (n = 4). c The proportion of CD4+, CD8+, CD4+CD8+ DP, and CD4CD8 DN T-cell subsets among total intrahepatic T cells (n = 4). d t-SNE map of intrahepatic T cells derived from CyTOF analysis. Rphenograph identified 13 T-cell subsets based on expression profiles of 28 markers. e Heatmap showing expression of 28 T-cell panel markers in 13 T-cell clusters. f Differences in the proportion of 2 CD4+ (T2 and T10), 7 CD8+ (T3, T5, T7, T8, T9, T11, T12), 3 DP (T1, T4, T6), and 1 DN (T13) T-cell clusters among total intrahepatic T cells (n = 4). WSX1 reduced the proportion of T1 (P = 0.0114), T5 (P = 0.0126) and T11 (P = 0.0216), while increased the proportion of T6 (P = 0.0003), T9 (P = 0.0016) and T13 subsets (P = 0.0453). All data are representative of 2 independent experiments. Quantitative data are presented as mean ± SD and analyzed by two-sided Student t test. *P < 0.05, **P < 0.01, ***P < 0.001. NK cells natural killer cells, Mϕ macrophages, DCs dendritic cells, DP double positive, DN double negative. Source data are provided as a Source Data file.
Fig. 4
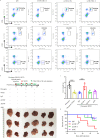
Fig. 4. WSX1-induced HCC regression is dependent on CD8+ T-cells.
Depletion antibodies against CD8+ T (α-CD8), CD4+ T (α-CD4), and NK (α-NK) cells were used for immune-cell depletion in the spontaneous HCC mouse model. a Efficiency of in vivo immune-cell depletion was validated by flow cytometry. The gating strategy for sorting CD8+ T-cells, CD4+ T-cells, and NK cells is shown in the supplementary Fig. 8a. b Effect of WSX1 on tumor growth with or without in vivo immune-cell depletion (n = 5). Red arrowheads represent WSX1 injection once a week. Green arrowheads represent injection of the indicated antibodies 3 times a week. c Depletion of CD8+ T-cells impaired WSX1-mediated inhibition of HCC formation (P = 0.0002). d Depletion of CD8+ T-cells decreased the WSX1-induced survival extension (HR = 7.078, P = 0.0338). All data and images are representative of 2 independent experiments. Quantitative data are presented as mean ± SD and analyzed by One-way ANOVA analysis. Tukey-Kramer multiple comparison tests were used for pairwise comparisons in the ANOVA analysis. The survival curves were analyzed by the Kaplan–Meier method, and the log-rank test was used to compare overall survival between groups. All statistical tests were two-sided. *P < 0.05, **P < 0.01, ***P < 0.001. Source data are provided as a Source Data file.
Fig. 5
Fig. 5. WSX1 overexpression downregulates PD-L1 expression in HCC cells.
a Protein levels of WSX1, FLAG, and PD-L1 analyzed by Western blotting. HCC cell lines SNU449 and SNU475 were transfected with plasmid DNA encoding WSX1-FLAG (449WSX1 and 475 WSX1) or with vector plasmids. b Effect of WSX1 overexpression on cell surface PD-L1 expression analyzed by flow cytometry. WSX1 overexpression reduced the proportion of PD-L1+ HCC cells in both SNU449 (n = 4 independent experiments, P < 0.0001) and SNU475 cells (P = 0.0002). c Immunoblotting analysis of protein levels of WSX1 and PD-L1 in SNU398 cells. CRISPR/Cas9 guiding RNAs against human WSX1 (crWSX1) were used for WSX1 knockdown, and non_targeting crRNAs were added as control (crCtrl). d WSX1 knockdown increased the proportion of PD-L1+ HCC cells in SNU398 cells (n = 4 independent experiments, P = 0.0028). e t-SNE map derived from CyTOF analysis of mouse hepatocytes obtained from the HCC mouse model in Fig. 2a. Cells were color coded by the intensity of the expression levels of PD-L1 and WSX1. f Difference in the proportions of PD-L1+ (n = 4 mice, P = 0.0012) and WSX1+ mouse hepatocytes (P = 0.0002) based on CyTOF analysis. Data shown are representative of 2 independent experiments. g Immunoblotting analysis of PD-L1 protein levels in mouse liver lysates (C1–C3 represent independent samples from “oncogene” group, T1–T3 are independent samples from “oncogene + WSX1” group). All images shown are representative of 3 independent experiments. Quantitative data are presented as mean ± SD and analyzed by two-sided Student t test. **P < 0.01, ***P < 0.001, ****P < 0.0001. The gating strategy for sorting PD-L1+ HCC cells is shown in Supplementary Fig. 8b. Source data are provided as a Source Data file.
Fig. 6
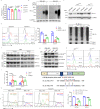
Fig. 6. WSX1 destabilizes PD-L1 by boosting GSK3β-mediated PD-L1 degradation.
a qRT-PCR assay revealed the influence of WSX1 on PD-L1 mRNA expression level (n = 3 independent experiments). b Influence of WSX1 on the expression of exogenous PD-L1-FLAG. SNU449 and SNU475 cells were transfected with plasmid DNA encoding PD-L1-FLAG with or without WSX1 co-transfection and analyzed by Western blotting. c Immunoblot analysis of PD-L1 protein levels after treatment with proteasome inhibitor MG132 for 12 h. d Effect of MG132 on cell surface PD-L1 expression examined by flow cytometry. MG132 inhibited WSX1-mediated PD-L1 reduction in both SNU449 (n = 5 independent experiments, P = 0.0027) and SNU475 cells (P = 0.0362). e Influence of WSX1 on PD-L1 ubiquitination. Cells were pretreated with MG132 for 12 h, and cellular PD-L1 protein was pulled down by specific PD-L1 antibodies. PD-L1 ubiquitination was analyzed by anti-ubiquitin antibodies. f Impact of WSX1 on half-life of PD-L1 protein in HCC cells. HCC cells were treated with 25 mM CHX for 0, 4, 8, and 12 h, and cell lysates were collected separately and analyzed for PD-L1 protein levels. g Influence of WSX1 on protein levels of p-GSK3βSer9, total GSK3β, p-β-cateninSer33/Ser37/Thr41, and total β-catenin. β-catenin was directly phosphorylated by GSK3β at Ser33/Ser37/Thr41, and the level of p-β-cateninSer33/Ser37/Thr41 indirectly reflects GSK3β activity. h Influence of GSK3β inhibitor LiCl or GSK3β knockdown on PD-L1 expression. Cell surface PD-L1 expression on WSX1-overexpressing 449WSX1 and 475 WSX1 cells was analyzed by flow cytometry after treatment of LiCl or transfection of GSK3β shRNAs for 48 h. i Statistical analysis results showing that both LiCl treatment (P = 0.0135 in 449WSX1 and P = 0.0052 in 475WSX1) and GSK3β knockdown (P = 0.0020 in 449WSX1 and P = 0.0015 in 475WSX1) increased the proportion of PD-L1+ HCC cells (n = 5 independent experiments). j Schematic of site-directed mutation of the consensus motif on PD-L1-NP (S176A, T180A, and S184A), which could not be phosphorylated by GSK3β. k SNU449 and SNU475 cells transfected with PD-L1-wild type (WT) or PD-L1-NP (mutated) alone or co-transfected with WSX1. Alterations in cell surface PD-L1 expression levels were determined by flow cytometry. l Quantification of PD-L1 MFI ratio. Site-directed mutation in PD-L1-NP impaired WSX1-mediated PD-L1 downregulation in both SNU449 (n = 3 independent experiments, P = 0.0066 compared to PD-L1-WT) and SNU475 cells (P = 0.0004 compared to PD-L1-WT). Quantitative data are presented as mean ± SD and analyzed by one-way ANOVA or Student t test. Tukey-Kramer multiple comparison test was used for pairwise comparisons in the ANOVA analysis. Unless otherwise noted, data and images shown are representative of 3 independent experiments. All statistical tests were two-sided. *P < 0.05, **P < 0.01, ***P < 0.001. CHX cycloheximide, SP signal peptide, TM transmembrane domain, ECD extracellular domain, ICD intracellular domain, MFI mean fluorescence intensity. The gating strategy for sorting PD-L1+ HCC cells is shown in Supplementary Fig. 8b. Source data are provided as a Source Data file.
Fig. 7
Fig. 7. WSX1 relieves inhibition of GSK3β activity through impeding the PI3Kδ/AKT signaling pathway.
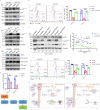
a Effect of WSX1 overexpression on protein levels of p-AKTSer473, AKT, p-TSC2Thr1462, and TSC2 in HCC cells determined by immunoblotting. TSC2 is directly phosphorylated at Thr1462 by AKT; thus p-TSC2Thr1462 levels indirectly reflect AKT activity. b Impact of AKT reactivation on WSX1-mediated PD-L1 downregulation detected by flow cytometry. SNU449 and SNU475 cells were transfected with WSX1 alone or co-transfected with membrane-bound myr-AKT. Statistical analysis results are shown on the right (n = 5 independent experiments, P < 0.0001 in both SNU449 and SNU475 cells). c Impact of myr-AKT transfection on protein levels of p-AKTSer473, total AKT, and PD-L1 in 449WSX1 and 475 WSX1 cells. d Immunoblotting analysis of expression of WSX1, PD-L1, and p-AKTSer473 in whole liver lysates obtained from FVB/NJ mice injected with NRAS/AKT oncogenes with or without WSX1 (left, C1–C4 represent independent samples from “oncogene” group, T1–T4 are independent samples from “oncogene + WSX1” group). Statistical analysis of correlations of WSX1 with PD-L1 and p-AKTSer473 expression in mouse livers (right). e Effect of WSX1 on expression of PTEN, PI3K-p85, PI3K-p110α, and PI3K-p110δ. f Impact of PIK3CD overexpression on WSX1-mediated PD-L1 reduction (left). PIK3CD encodes PI3K-p110δ, which is the key component of PI3Kδ. Reintroduction of PIK3CD impaired WSX1-induced PD-L1 reduction in both SNU449 (n = 5 independent experiments, P = 0.0001) and SNU475 cells (P = 0.0013). g Effect of WSX1 on PIK3CD mRNA levels in SNU449 (n = 3 independent experiments P = 0.0139) and SNU475 HCC cells (P = 0.0006). h A proposed model illustrating that WSX1 facilitates antitumor immune surveillance through inhibiting the PI3Kδ/AKT/GSK3β/PD-L1 signaling pathway. Under physiological conditions, highly expressed WSX1 in hepatocytes transcriptionally downregulates PIK3δ, thereby reducing AKT activation and subsequently liberating GSK3β kinase activity from inhibition by AKT, leading to boosted GSK3β-mediated PD-L1 degradation. Without excessive PD-L1 expression on tumor cells, effector CD8+ T cells maximize their killing effect, resulting in inhibition of HCC development (Left). Otherwise, lack of WSX1 results in uncontrolled neoplastic PD-L1 expression and, ultimately, tumor immune evasion (Right). i Schematic diagram of the interactions among WSX1, PI3Kδ, AKT, GSK3β, and PD-L1. Quantitative data are presented as mean ± SD and were analyzed by one-way ANOVA or Student t test. Tukey-Kramer multiple comparison test was used for pairwise comparisons in the ANOVA analysis. Correlation analyses were performed by Pearson correlation test. Unless otherwise noted, data and images shown are representative of 3 independent experiments. All statistical tests were two-sided. *P < 0.05, **P < 0.01, ***P < 0.001. myr-AKT myristoylated AKT. The gating strategy for sorting PD-L1+ HCC cells is shown in supplementary Fig. 8b. Source data are provided as a Source Data file.

Similar articles

Cited by

References

    1. Siegel RL, Miller KD, Jemal A. Cancer statistics, 2020. CA Cancer J. Clin. 2020;70:7–30. - PubMed
    1. Llovet JM, et al. Hepatocellular carcinoma. Nat. Rev. Dis. Prim. 2016;2:16018. doi: 10.1038/nrdp.2016.18. - DOI - PubMed
    1. Villanueva A. Hepatocellular carcinoma. N. Engl. J. Med. 2019;380:1450–1462. doi: 10.1056/NEJMra1713263. - DOI - PubMed
    1. Kanda M, Sugimoto H, Kodera Y. Genetic and epigenetic aspects of initiation and progression of hepatocellular carcinoma. World J. Gastroenterol. 2015;21:10584–10597. doi: 10.3748/wjg.v21.i37.10584. - DOI - PMC - PubMed
    1. Ringelhan M, Pfister D, O’Connor T, Pikarsky E, Heikenwalder M. The immunology of hepatocellular carcinoma. Nat. Immunol. 2018;19:222–232. doi: 10.1038/s41590-018-0044-z. - DOI - PubMed

Publication types

MeSH terms

  NODES
INTERN 1
Note 2
twitter 2