. 2021 Jun 21;12(7):636.
doi: 10.1038/s41419-021-03909-z.

Diagnostic and prognostic potential of the proteomic profiling of serum-derived extracellular vesicles in prostate cancer

Affiliations

Diagnostic and prognostic potential of the proteomic profiling of serum-derived extracellular vesicles in prostate cancer

Michele Signore et al. Cell Death Dis. .

Abstract

Extracellular vesicles (EVs) and their cargo represent an intriguing source of cancer biomarkers for developing robust and sensitive molecular tests by liquid biopsy. Prostate cancer (PCa) is still one of the most frequent and deadly tumor in men and analysis of EVs from biological fluids of PCa patients has proven the feasibility and the unprecedented potential of such an approach. Here, we exploited an antibody-based proteomic technology, i.e. the Reverse-Phase Protein microArrays (RPPA), to measure key antigens and activated signaling in EVs isolated from sera of PCa patients. Notably, we found tumor-specific protein profiles associated with clinical settings as well as candidate markers for EV-based tumor diagnosis. Among others, PD-L1, ERG, Integrin-β5, Survivin, TGF-β, phosphorylated-TSC2 as well as partners of the MAP-kinase and mTOR pathways emerged as differentially expressed endpoints in tumor-derived EVs. In addition, the retrospective analysis of EVs from a 15-year follow-up cohort generated a protein signature with prognostic significance. Our results confirm that serum-derived EV cargo may be exploited to improve the current diagnostic procedures while providing potential prognostic and predictive information. The approach proposed here has been already applied to tumor entities other than PCa, thus proving its value in translational medicine and paving the way to innovative, clinically meaningful tools.


Conflict of interest statement

The authors declare no competing interests.

Figures
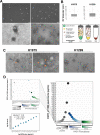
Fig. 1
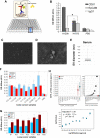
Fig. 1. Isolation and RPPA testing of cell line-derived EVs.
A Representative images of EVs purified from conditioned medium of H1975 and H1299 cells by Scanning and Transmission Electron Microscopy (SEM and TEM) analyses, upper and lower panels, respectively. The images shown are representative of all cell lines used in the article. B Boxplots representative of H1975 and H1299 EVs size distribution evaluated by SEM analysis. The lower schematic representation exemplifies the size distribution of EVs. C EpCAM antigen evaluated in EVs purified from cultures of H1975 and H1299 by Immuno-Electron Microscopy (IEM). D RPPA measurement of absolute amounts of EGFR_pY1068 in A431 and fibroblasts. Whole cell and EV lysates were first diluted to a total protein concentration of 0.5 mg/ml and then printed as mixtures with the indicated decreasing and increasing fractions of A431 and fibroblasts, respectively. A dilution curve of EGFR_pY1068 synthetic peptide in the plotted range, was printed along with cell line and EV samples and provided a reference curve (lower-left panel) to predict absolute concentrations of EGFR_pY1068 in A431 and fibroblast mixtures (upper panel). Data in the left side of the upper panel represent a magnification of the low picogram range from the adjacent (right) scatterplot. Main points represent the mean of technical replicates (n = 3, empty symbols behind each main-colored point). The reference curve in the lower panel has been used to predict EGFR_pY1068 absolute levels in samples via simple linear regression (red line) of log10-converted triplicates of normalized RPPA levels from the EGFR_pY1068 synthetic peptide dilution curve. Adjusted r squared, regression formula and p-value are shown inside the reference curve plot.
Fig. 2
Fig. 2. Orthogonal validation of RPPA results on serum-derived EVs.
A Representative scheme of our homemade ELISA test, i.e. ELEXO, including EV-coated microtiter plate, primary antibody, HRP-conjugated secondary antibody and colorimetric reaction with TMB substrate. B H1975 and H1299 EVs analyzed by ELEXO assay. IgG isotype and Phosphate-Buffered Saline (PBS) were used as internal controls. Data are reported as mean and SD (n = 3) of arbitrary units of O.D. (Optical Density) at the specified wavelength (nm) (*p = 0.02). C, D Representative images of SEM (C) and TEM (D) analysis of EVs isolated from the sera of prostate cancer patients. Images are representative of pivotal and training cohort PCas. E Box plot representative of serum EV size distribution evaluated by SEM analysis. F, G ELEXO measurement of EpCAM (F) and PD-L1 (G) antigens in EVs isolated from colon and lung cancer patients, respectively. CD81 has been used as endogenous EV control. Data are reported as mean and SD (n = 3) of arbitrary units of O.D. (Optical Density) at the specified wavelength (nm). Internal reference controls were reported as IgG, CD-81, EpCAM, or PD-L1 antibody in PBS condition. H Absolute RPPA quantification of EGFR_pY1068 synthetic peptide in dilution curve along with isolated EVs from sera of colon and lung cancer patients. The expression levels in EVs fall below the lowest EGFR_pY1068 peptide dilution point and their scale is magnified in the left panel of the plot. The reference curve in the lower panel was obtained as in Fig. 1D to predict absolute EGFR_pY1068 RPPA levels in EV samples.
Fig. 3
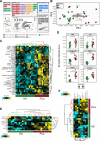
Fig. 3. RPPA study sets and results on the pivotal cohort.
A Schematic representation of the experimental study design. The cohorts assayed comprise a (i) pivotal group of primary prostate cancer (PCa) and healthy donor (HD) samples that have been utilized for experimental setup, i.e. EV isolation and RPPA sensitivity tests, (ii) training cohort including PCa, hypertrophic (Hyper), post-prostatectomy-disease-free (DF) cases as well as healthy donor (HD) EV samples and used to confirm and expand upon the RPPA analysis of the pivotal cohort in search of diagnostic markers, iii) a set of two independent cohorts of PCa samples used for risk assessment and prognostic marker evaluation, respectively. The risk assessment cohort comprises samples with 15-year documented follow-up (recurrent and non-recurrent). The prognostic marker evaluation cohort is composed of forty primary cell lines established from patients with bad and good documented prognosis [66]. B Principal component analysis (PCA) of 37 RPPA endpoints measured in EV samples from the pivotal cohort (16 healthy donor, HD, and 12 tumors, PCa). PCA algorithm employed the covariance matrix obtained from normalized RPPA intensity values. Scores (i.e. samples) are represented as dots (HD, green) and squares (PCa, red) while loadings (i.e. RPPA antibodies) are overlaid and pointed by gray arrows. C Two-way unsupervised hierarchical clustering of the same dataset as in (B). Normalized RPPA intensity values were pre-standardized (Z score) and the color intensity scale indicates high (yellow), average (black) and low (cyan) relative expression. D Scatterplots of selected statistically significant RPPA endpoints, resulting from comparison of HD- and PCa-derived EVs. Statistical significance by Student’s t test is reported on each plot and coded with asterisk(s) based on the level of significance (*p < = 0.05, **p < = 0.01, ***p < = 0.001). E, F Two-way unsupervised hierarchical clustering on selected panels of significant RPPA endpoints (p < = 0.05) associated with growth factor receptor signaling and angiogenesis (respectively E, F). Statistical significance was calculated by comparing normalized RPPA intensity values of HD and PCa, as in (D). Hierarchical clustering was performed on standardized RPPA data as in (C) and Z scores are color-coded as high (yellow), average (black) and low (cyan).
Fig. 4
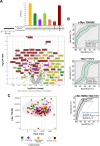
Fig. 4. Group comparisons and biomarker analysis on the training cohort.
A Combined Up Set [94] and volcano plots, with color-coded annotations of diverse RPPA endpoint sets that characterize specific binary comparisons of sample groups. The vertical histogram (upper panel) reports the relative frequency of unique (single dots) and shared (connected dots) significant RPPA antibodies resulting from three specific sets of statistical comparisons, namely PCa versus Hypertrofic, HD and Post-prostatectomy disease free (DF), respectively. The volcano plot in the lower panel shows fold-changes (log2) versus significance [−log10(p - value)] for all analyzed comparison sets (i.e. PCa versus Hypertrofic or HD or disease-free, respectively). The color-coding (‘queries’) of RPPA antibody labels in the volcano plot matches the corresponding colors sets in the main frequency histogram. The horizontal histogram adjacent to comparison sets (left-bottom part of the upper panel) shows the absolute frequency of statistically significant RPPA antibodies obtained for each individual set. B Univariate ROC curve analysis of two selected, significant candidate markers resulting from statistical comparison of controls (grouped HD plus Hypertrophic diseases) and tumors (upper plots). The diagnostic performance of combined top-scoring candidates was further assessed by ROC curve analysis (bottom plot). All plots report the AUC value along with the 95% confidence interval as well as p, optimal cut-off, sensitivity and specificity values. C Bivariate plot of best candidates (c-Myc T58/S62 and TSC2 Y1571) normalized RPPA intensity values in the analyzed cohort comprising tumors (PCa) and control samples, i.e. HD and Hypertrophic diseases, the latter subdivided into Adenoma and Inflammatory diseases, being the category ‘others’ referred to grouped non-neoplastic samples (controls). The ellipses represent the probability of distribution (95% confidence under normality assumption) for the two main comparison groups, namely PCa and others.
Fig. 5
Fig. 5. Analysis of EV-based prognostic RPPA biomarkers.
A Bar chart of log2 fold-change (log2FC) of grouped high-risk and advanced PCa (red) versus low-/intermediate-risk (green) patients for all significantly different RPPA endpoints analyzed by Wilcoxon rank-sum test. Statistical significance reported for each bar is coded with asterisk(s) based on the level of significance (*p < = 0.05, **p < = 0.01, ***p < = 0.001). B Two-way unsupervised hierarchical clustering of the 13 significantly different (p < = 0.05) RPPA endpoints emerging from statistical comparison of non-recurrent (pink, n = 11) and grouped recurrent and advanced tumor (gray, n = 13) EV samples. One sample was excluded due to lacking follow-up information. C Scatterplots of ERG expression resulting from comparison of low/intermediate-, high-risk and advanced (Adv. PCa) tumors by RPPA analysis. Recurrent patients were indicated by an asterisk (*). The plots represent distribution of RPPA intensity values, and the line indicates an arbitrary baseline. Statistical comparisons were performed as described in the methods section.

Similar articles

Cited by

References

    1. Bray F, Ferlay J, Soerjomataram I, Siegel RL, Torre LA, Jemal A. Global cancer statistics 2018: GLOBOCAN estimates of incidence and mortality worldwide for 36 cancers in 185 countries. CA: Cancer J. Clin. 2018;68:394–424. - PubMed
    1. De Angelis R, Sant M, Coleman MP, Francisci S, Baili P, Pierannunzio D, et al. Cancer survival in Europe 1999-2007 by country and age: results of EUROCARE–5-a population-based study. Lancet Oncol. 2014;15:23–34. doi: 10.1016/S1470-2045(13)70546-1. - DOI - PubMed
    1. Walters S, Maringe C, Coleman MP, Peake MD, Butler J, Young N, et al. Lung cancer survival and stage at diagnosis in Australia, Canada, Denmark, Norway, Sweden and the UK: a population-based study, 2004–2007. Thorax. 2013;68:551–64. doi: 10.1136/thoraxjnl-2012-202297. - DOI - PubMed
    1. Neppl-Huber C, Zappa M, Coebergh JW, Rapiti E, Rachtan J, Holleczek B, et al. Changes in incidence, survival and mortality of prostate cancer in Europe and the United States in the PSA era: additional diagnoses and avoided deaths. Ann Oncol. 2012;23:1325–34. doi: 10.1093/annonc/mdr414. - DOI - PubMed
    1. O’Brien K, Breyne K, Ughetto S, Laurent LC, Breakefield XO. RNA delivery by extracellular vesicles in mammalian cells and its applications. Nat Rev Mol Cell Biol. 2020;21:585–606. doi: 10.1038/s41580-020-0251-y. - DOI - PMC - PubMed

Publication types

  NODES
INTERN 2
twitter 2