Cannabis constituents interact at the drug efflux pump BCRP to markedly increase plasma cannabidiolic acid concentrations
- PMID: 34294753
- PMCID: PMC8298633
- DOI: 10.1038/s41598-021-94212-6
Cannabis constituents interact at the drug efflux pump BCRP to markedly increase plasma cannabidiolic acid concentrations
Abstract
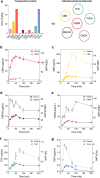
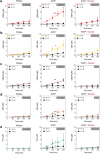
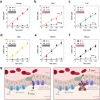
Cannabis is a complex mixture of hundreds of bioactive molecules. This provides the potential for pharmacological interactions between cannabis constituents, a phenomenon referred to as "the entourage effect" by the medicinal cannabis community. We hypothesize that pharmacokinetic interactions between cannabis constituents could substantially alter systemic cannabinoid concentrations. To address this hypothesis we compared pharmacokinetic parameters of cannabinoids administered orally in a cannabis extract to those administered as individual cannabinoids at equivalent doses in mice. Astonishingly, plasma cannabidiolic acid (CBDA) concentrations were 14-times higher following administration in the cannabis extract than when administered as a single molecule. In vitro transwell assays identified CBDA as a substrate of the drug efflux transporter breast cancer resistance protein (BCRP), and that cannabigerol and Δ9-tetrahydrocannabinol inhibited the BCRP-mediated transport of CBDA. Such a cannabinoid-cannabinoid interaction at BCRP transporters located in the intestine would inhibit efflux of CBDA, thus resulting in increased plasma concentrations. Our results suggest that cannabis extracts provide a natural vehicle to substantially enhance plasma CBDA concentrations. Moreover, CBDA might have a more significant contribution to the pharmacological effects of orally administered cannabis extracts than previously thought.
© 2021. The Author(s).
Conflict of interest statement
Associate Professor Arnold has served as an expert witness in various medicolegal cases involving cannabis and cannabinoids and serves as a temporary advisor to the World Health Organization (WHO) on their review of cannabis and the cannabinoids. The remaining authors have no conflicts of interest.
Figures


Similar articles
-
Tetrahydrocannabinol and Its Major Metabolites Are Not (or Are Poor) Substrates or Inhibitors of Human P-Glycoprotein [ATP-Binding Cassette (ABC) B1] and Breast Cancer Resistance Protein (ABCG2).Drug Metab Dispos. 2021 Oct;49(10):910-918. doi: 10.1124/dmd.121.000505. Epub 2021 Jul 29. Drug Metab Dispos. 2021. PMID: 34326138 Free PMC article.
-
Plasma concentrations of eleven cannabinoids in cattle following oral administration of industrial hemp (Cannabis sativa).Sci Rep. 2020 Jul 29;10(1):12753. doi: 10.1038/s41598-020-69768-4. Sci Rep. 2020. PMID: 32728233 Free PMC article.
-
Analysis of cannabinoids in commercial hemp seed oil and decarboxylation kinetics studies of cannabidiolic acid (CBDA).J Pharm Biomed Anal. 2018 Feb 5;149:532-540. doi: 10.1016/j.jpba.2017.11.044. Epub 2017 Nov 20. J Pharm Biomed Anal. 2018. PMID: 29182999
-
Cannabis sativa L. and Nonpsychoactive Cannabinoids: Their Chemistry and Role against Oxidative Stress, Inflammation, and Cancer.Biomed Res Int. 2018 Dec 4;2018:1691428. doi: 10.1155/2018/1691428. eCollection 2018. Biomed Res Int. 2018. PMID: 30627539 Free PMC article. Review.
-
Therapeutic potential of cannabinoids in combination cancer therapy.Adv Biol Regul. 2021 Jan;79:100774. doi: 10.1016/j.jbior.2020.100774. Epub 2021 Jan 6. Adv Biol Regul. 2021. PMID: 33422460 Review.
Cited by
-
Pharmacokinetics and tolerability of single-dose enteral cannabidiol and cannabidiolic acid rich hemp in horses (Equus caballus).Front Vet Sci. 2024 Apr 12;11:1356463. doi: 10.3389/fvets.2024.1356463. eCollection 2024. Front Vet Sci. 2024. PMID: 38681854 Free PMC article.
-
Oral Cannabis consumption and intraperitoneal THC:CBD dosing results in changes in brain and plasma neurochemicals and endocannabinoids in mice.J Cannabis Res. 2024 Mar 2;6(1):10. doi: 10.1186/s42238-024-00219-x. J Cannabis Res. 2024. PMID: 38429800 Free PMC article.
-
Clinical Outcome Data of Children Treated with Cannabis-Based Medicinal Products for Treatment Resistant Epilepsy-Analysis from the UK Medical Cannabis Registry.Neuropediatrics. 2023 Jun;54(3):174-181. doi: 10.1055/a-2002-2119. Epub 2022 Dec 20. Neuropediatrics. 2023. PMID: 36539215 Free PMC article.
-
An Examination of the Anti-Cancer Properties of Plant Cannabinoids in Preclinical Models of Mesothelioma.Cancers (Basel). 2022 Aug 5;14(15):3813. doi: 10.3390/cancers14153813. Cancers (Basel). 2022. PMID: 35954477 Free PMC article.
-
Decoding the Postulated Entourage Effect of Medicinal Cannabis: What It Is and What It Isn't.Biomedicines. 2023 Aug 21;11(8):2323. doi: 10.3390/biomedicines11082323. Biomedicines. 2023. PMID: 37626819 Free PMC article. Review.
References
Publication types
MeSH terms
Substances
LinkOut - more resources
Full Text Sources

