Bone marrow-derived mesenchymal stem cells promote Helicobacter pylori-associated gastric cancer progression by secreting thrombospondin-2
- PMID: 34435402
- PMCID: PMC8488559
- DOI: 10.1111/cpr.13114
Bone marrow-derived mesenchymal stem cells promote Helicobacter pylori-associated gastric cancer progression by secreting thrombospondin-2
Abstract
Objectives: Bone marrow-derived cells (BMDCs), especially mesenchymal stem cells (MSCs), may be involved in the development of Helicobacter pylori-associated gastric cancer (GC) in mice, but the specific mechanism remains unclear, and evidence from human studies is lacking.
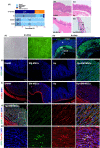
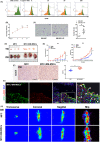
Materials and methods: To verify the role of BM-MSCs in H pylori-associated GC, green fluorescent protein (GFP)-labelled BM-MSCs were transplanted into the subserosal layers of the stomach in a mouse model of chronic H pylori infection. Three months post-transplantation, the mice were sacrificed, and the gastric tissues were subjected to histopathological and immunofluorescence analyses. In addition, we performed fluorescence in situ hybridization (FISH) and immunofluorescence analyses of gastric tissue from a female patient with H pylori infection and a history of acute myeloid leukaemia who received a BM transplant from a male donor.
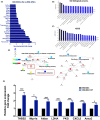
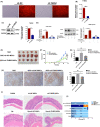
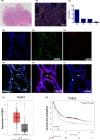
Results: In mice with chronic H pylori infection, GFP-labelled BM-MSCs migrated from the serous layer to the mucosal layer and promoted GC progression. The BM-MSCs differentiated into pan-cytokeratin-positive epithelial cells and α-smooth muscle actin-positive cancer-associated fibroblasts (CAFs) by secreting the protein thrombospondin-2. FISH analysis of gastric tissue from the female patient revealed Y-chromosome-positive cells. Immunofluorescence analyses further confirmed that Y-chromosome-positive cells showed positive BM-MSCs marker. These results suggested that allogeneic BMDCs, including BM-MSCs, can migrate to the stomach under chronic H pylori infection.
Conclusions: Taken together, these findings imply that BM-MSCs participate in the development of chronic H pylori-associated GC by differentiating into both gastric epithelial cells and CAFs.
Keywords: Helicobacter pylori; Bone marrow-derived mesenchymal stem cells (BM-MSCs); Cancer-associated fibroblasts (CAFs); Gastric cancer (GC); Thrombospondin-2.
© 2021 The Authors. Cell Proliferation published by John Wiley & Sons Ltd.
Conflict of interest statement
None.
Figures
Similar articles
-
THBS4/integrin α2 axis mediates BM-MSCs to promote angiogenesis in gastric cancer associated with chronic Helicobacter pylori infection.Aging (Albany NY). 2021 Aug 14;13(15):19375-19396. doi: 10.18632/aging.203334. Epub 2021 Aug 14. Aging (Albany NY). 2021. PMID: 34390328 Free PMC article.
-
Bone marrow-derived mesenchymal stem cells favor the immunosuppressive T cells skewing in a Helicobacter pylori model of gastric cancer.Stem Cells Dev. 2013 Nov 1;22(21):2836-48. doi: 10.1089/scd.2013.0166. Epub 2013 Aug 16. Stem Cells Dev. 2013. PMID: 23777268
-
Native and bone marrow-derived cell mosaicism in gastric carcinoma in H. pylori-infected p27-deficient mice.Onco_target. 2016 Oct 25;7(43):69136-69148. doi: 10.18632/onco_target.12049. Onco_target. 2016. PMID: 27655701 Free PMC article.
-
Helicobacter pylori infection and stem cells at the origin of gastric cancer.Oncogene. 2015 May 14;34(20):2547-55. doi: 10.1038/onc.2014.187. Epub 2014 Jul 21. Oncogene. 2015. PMID: 25043305 Review.
-
Chemoprevention of gastric cancer by Helicobacter pylori eradication and its underlying mechanism.J Gastroenterol Hepatol. 2019 Aug;34(8):1287-1295. doi: 10.1111/jgh.14646. Epub 2019 Mar 27. J Gastroenterol Hepatol. 2019. PMID: 30828872 Review.
Cited by
-
Mechanisms of Potential Therapeutic Utilization of Mesenchymal Stem Cells in COVID-19 Treatment.Cell Transplant. 2023 Jan-Dec;32:9636897231184611. doi: 10.1177/09636897231184611. Cell Transplant. 2023. PMID: 37395459 Free PMC article. Review.
-
Emerging Role of Helicobacter pylori in the Immune Evasion Mechanism of Gastric Cancer: An Insight Into Tumor Microenvironment-Pathogen Interaction.Front Oncol. 2022 Jun 20;12:862462. doi: 10.3389/fonc.2022.862462. eCollection 2022. Front Oncol. 2022. PMID: 35795038 Free PMC article. Review.
-
Gamma-glutamyltransferase of Helicobacter pylori alters the proliferation, migration, and pluripotency of mesenchymal stem cells by affecting metabolism and methylation status.J Microbiol. 2022 Jun;60(6):627-639. doi: 10.1007/s12275-022-1575-4. Epub 2022 Apr 18. J Microbiol. 2022. PMID: 35437622
-
Helicobacter pylori-activated fibroblasts as a silent partner in gastric cancer development.Cancer Metastasis Rev. 2023 Dec;42(4):1219-1256. doi: 10.1007/s10555-023-10122-1. Epub 2023 Jul 17. Cancer Metastasis Rev. 2023. PMID: 37460910 Free PMC article. Review.
-
Helicobacter pylori and Its Role in Gastric Cancer.Microorganisms. 2023 May 17;11(5):1312. doi: 10.3390/microorganisms11051312. Microorganisms. 2023. PMID: 37317287 Free PMC article. Review.
References
-
- Sung H, Ferlay J, Siegel RL, et al. Global Cancer Statistics 2020: GLOBOCAN Estimates of Incidence and Mortality Worldwide for 36 Cancers in 185 Countries. Cancer J Clin. 2021;71(3):209‐249. - PubMed
-
- Deng W, Jin L, Zhuo H, Vasiliou V, Zhang Y. Alcohol consumption and risk of stomach cancer: A meta‐analysis. Chem Biol Interact. 2021;336:109365. - PubMed
-
- Lyons K, Le LC, Pham YT, et al. Gastric cancer: epidemiology, biology, and prevention: a mini review. Eur J Cancer Prev. 2019;28(5):397‐412. - PubMed
MeSH terms
Substances
Grants and funding
LinkOut - more resources
Full Text Sources
Medical
Miscellaneous

