. 2021 Dec;190(3):373-387.
doi: 10.1007/s10549-021-06398-y. Epub 2021 Sep 22.

Methionine restriction exposes a _targetable redox vulnerability of triple-negative breast cancer cells by inducing thioredoxin reductase

Affiliations

Methionine restriction exposes a _targetable redox vulnerability of triple-negative breast cancer cells by inducing thioredoxin reductase

Dmitry Malin et al. Breast Cancer Res Treat. 2021 Dec.

Abstract

Purpose: Tumor cells are dependent on the glutathione and thioredoxin antioxidant pathways to survive oxidative stress. Since the essential amino acid methionine is converted to glutathione, we hypothesized that methionine restriction (MR) would deplete glutathione and render tumors dependent on the thioredoxin pathway and its rate-limiting enzyme thioredoxin reductase (TXNRD).

Methods: Triple (ER/PR/HER2)-negative breast cancer (TNBC) cells were treated with control or MR media and the effects on reactive oxygen species (ROS) and antioxidant signaling were examined. To determine the role of TXNRD in MR-induced cell death, TXNRD1 was inhibited by RNAi or the pan-TXNRD inhibitor auranofin, an antirheumatic agent. Metastatic and PDX TNBC mouse models were utilized to evaluate in vivo antitumor activity.

Results: MR rapidly and transiently increased ROS, depleted glutathione, and decreased the ratio of reduced glutathione/oxidized glutathione in TNBC cells. TXNRD1 mRNA and protein levels were induced by MR via a ROS-dependent mechanism mediated by the transcriptional regulators NRF2 and ATF4. MR dramatically sensitized TNBC cells to TXNRD1 silencing and the TXNRD inhibitor auranofin, as determined by crystal violet staining and caspase activity; these effects were suppressed by the antioxidant N-acetylcysteine. H-Ras-transformed MCF-10A cells, but not untransformed MCF-10A cells, were highly sensitive to the combination of auranofin and MR. Furthermore, dietary MR induced TXNRD1 expression in mammary tumors and enhanced the antitumor effects of auranofin in metastatic and PDX TNBC murine models.

Conclusion: MR exposes a vulnerability of TNBC cells to the TXNRD inhibitor auranofin by increasing expression of its molecular _target and creating a dependency on the thioredoxin pathway.

Keywords: Auranofin; Cancer; Glutathione; Methionine; Nutrition; Oxidative stress; Thioredoxin.


Conflict of interest statement

Conflict of interest

The authors declare that they have no conflict of interest.

Figures
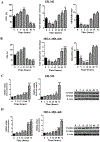
Fig. 1
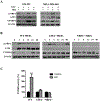
Fig. 1. Methionine restriction transiently initiates oxidative stress and induces TXNRD1 and TXNRD2.
A and B, GILM2 (A) and MDA-MB-468 (B) TNBC cells were grown in control or MR media for the indicated number of hours. ROS levels (expressed as percentage at time t=0), total glutathione levels, and GSH/GSSG ratios were determined (mean ± SEM, n = 3). C and D, GILM2 (C) and MDA-MB-468 (D) were grown in control or MR media for the indicated number of hours. mRNA levels of TXNRD1 (left panel) and TXNRD2 (middle panel) in TNBC cells were determined by real-time PCR and were normalized to expression in control media (mean ± SEM, n = 3). Right Panel: Immunoblot of TXNRD1 and TXNRD2 protein levels in TNBC cells grown for the indicated number of hours in MR media. In all panels, *, P < 0.05, **, P < 0.01, ***, P < 0.001 vs. t = 0
Fig. 2
Fig. 2. Methionine restriction induces TXNRD1 by a ROS-, NRF2- and ATF4-dependent mechanism.
A, Immunoblot of p-NRF2, ATF4 and TXNRD1 expression in GILM2 (left) and MDA-MB-468 (right) cells cultured in control or MR media for 24 hours in the presence or absence of NAC (2 mM). B, Immunoblot of p-NRF2, ATF4 and TXNRD1 expression in WT, ATF4−/− and NRF2−/− MEFs grown in MR media for the indicated number of hours. C, TXNRD activity (expressed as percentage of time t=0) was determined in the indicated MEFs cultured in control or MR media for 48 hours (mean ± SEM, n = 3). ***, P < 0.001 vs. control
Fig. 3
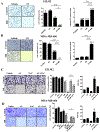
Fig. 3. Methionine restriction sensitizes TNBC cells to auranofin by an ROS-dependent mechanism.
A and B, Crystal violet cell survival assay of GILM2 (A) and MDA-MB-468 (B) TNBC cells grown in control or MR media for 72 hours and treated with vehicle or auranofin (1 μM) for the final 24 hours. Left panel: representative images. Middle panel: quantification of percentage confluence performed by counting cells in 3 fields of each well (mean ± SEM, n = 3). Right panel: GILM2 (A) and MDA-MB-468 (B) TNBC cells grown in control or MR media for 72 hours, treated with vehicle or auranofin (1 μM) for the final 24 hours, and caspase-3/7 activity was measured (expressed as fold control, mean ± SEM, n=3). C and D, Crystal violet cell survival assay of GILM2 (C) and MDA-MB-468 (D) TNBC cells cultured in control or MR media for 72 hours in presence or absence of NAC (2 mM) and treated with vehicle or auranofin (1 μM) for the final 24 hours. Left panel: representative images. Middle panel: quantification of percentage confluence performed by counting cells in 3 fields of each well (mean ± SEM, n = 3). Right panel: GILM2 (C) and MDA-MB-468 (D) cells were grown in control or MR media for 72 hours, treated with vehicle or auranofin (1 μM) for the final 24 hours, and ROS levels (expressed as percentage control) were determined (mean ± SEM, n = 3). In all panels, *, P < 0.05, **, P < 0.01, ***, P < 0.001 vs. control or the indicated comparison
Fig. 4
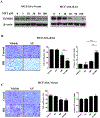
Fig. 4. Transformed breast epithelial cells are more sensitive to the combination of methionine restriction and auranofin.
A, Immunoblot of TXNRD1 expression in MCF-10A breast epithelial cells stably expressing vector or H-RasV12 cultured in different concentrations of methionine (0–100 μM) for 72 hours. B and C, Crystal violet cell survival assay of MCF-10A-Ras (B) and MCF-10A-Vector (C) cells grown in control or MR media for 72 hours and treated with vehicle or auranofin (1 μM) for the final 24 hours. Left panel: representative images. Middle panel: quantification of percentage confluence performed by counting cells in 3 fields of each well (mean ± SEM, n = 3). Right panel: MCF-10A-Ras (B) and MCF-10A-Vector (C) cells were grown in control or MR media for 72 hours, treated with vehicle or auranofin (1 μM) for the final 24 hours, and caspase-3/7 activity was determined (expressed as fold control, mean ± SEM, n=3). In all panels, *, P < 0.05, **, P < 0.01, ***, P < 0.001 vs. vehicle control or the indicated comparison
Fig. 5
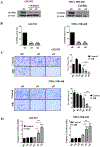
Fig. 5. Silencing TXNRD1 sensitizes TNBC cells to methionine restriction.
A, Immunoblot analysis of TXNRD1 expression in GILM2 (left) and MDA-MB-468 (right) cells transfected with a scrambled control siRNA (siC) or one of two different siRNAs _targeting TXNRD1 (si1 and si2) and grown in control media for 72 hours. B, TXNRD activity in GILM2 (left) and MDA-MB-468 (right) cells transfected with a scrambled control siRNA or one of two different siRNAs _targeting TXNRD1 (si1 and si2) and grown in control media for 72 hours. TXNRD activity is presented as the percentage activity in TNBC cells treated with the scrambled control siRNA (mean ± SEM, n = 3). C, Crystal violet cell survival assay of GILM2 and MDAMB-468 cells transfected with a scrambled control siRNA or one of two different siRNAs _targeting TXNRD1 (si1 and si2) and cultured in control or MR media for 72 hours. Left panel: representative images. Right panel: quantification of percentage confluence performed by counting cells in 3 fields of each well (mean ± SEM, n = 3). D, GILM2 (left) and MDA-MB-468 (right) were transfected with a scrambled control siRNA or one of two different siRNAs _targeting TXNRD1 (si2 and si2), grown in control or MR media for 48 hours, and caspase-3/7 activity was measured (expressed as fold activity of control cells, mean ± SEM, n=3). In all panels, *, P < 0.05, **, P < 0.01, ***, P < 0.001 vs. control or the indicated comparison
Fig. 6
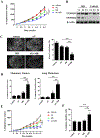
Fig. 6. Dietary methionine restriction augments the antitumor effects of auranofin in a metastatic TNBC mouse model.
Female NSG mice with GILM2-mCherry mammary tumors (two per mouse, A-D) or PDX TNBC tumors (E-F) were randomly assigned to one of four treatment groups (10 mice per group): control diet plus vehicle, control diet plus auranofin (10 mg/kg daily), MR diet plus vehicle, or MR diet plus auranofin (10 mg/kg daily). The diets were started 2.5 (GILM2) or 8 (PDX) weeks after tumor injection and were continued throughout the treatment period. A, Percentage original GILM2 mammary tumor volume at 2.5 weeks in each group (mean ± SEM, n = 10 mice per group). B, Immunoblot of TXNRD1 and TXNRD2 expression in GILM2 mammary tumors from mice on the control or MR diet. C, Representative images of resected whole lungs at autopsy visualized by fluorescence microscopy in GILM2 model. The percentage of the surface area occupied by fluorescent lung metastases (mean ± SEM, n = 10 mice per group) is indicated. D, The percentage active caspase-3-positive tumor cells in GILM2 mammary tumors (left panel) or GILM2 lung metastases (right panel) after treatment (mean ± SEM, n = 3 tumors per group). E, Percentage original PDX tumor volume at 8 weeks in each group (mean ± SEM, n = 10 mice per group). F, The percentage active caspase-3-positive tumor cells in primary PDX mammary tumors. In all panels, *, P < 0.05, **, P < 0.01, ***, P < 0.001 vs. vehicle-treated mice or the indicated comparison

Similar articles

Cited by

References

    1. Schieber M, Chandel NS. (2014) ROS function in redox signaling and oxidative stress. Curr Biol 24:R453–R462. 10.1016/j.cub.2014.03.034 - DOI - PMC - PubMed
    1. Gorrini C, Harris IS, Mak TW. (2013) Modulation of oxidative stress as an anticancer strategy. Nat Rev Drug Discov 12:931–947. 10.1038/nrd4002 - DOI - PubMed
    1. Bansal A, Simon MC. (2018) Glutathione metabolism in cancer progression and treatment resistance. J Cell Biol 217:2291–2298. 10.1083/jcb.201804161 - DOI - PMC - PubMed
    1. Zhang J, Li X, Han X, Liu R, Fang J. (2017) _targeting the thioredoxin system for cancer therapy. Trends Pharmacol Sci 38:794–808. 10.1016/j.tips.2017.06.001 - DOI - PubMed
    1. Fath MA, Ahmad IM, Smith CJ, Spence J, Spitz DR. (2011) Enhancement of carboplatin-mediated lung cancer cell killing by simultaneous disruption of glutathione and thioredoxin metabolism. Clin Cancer Res 17:6206–17. 10.1158/1078-0432.CCR-11-0736 - DOI - PMC - PubMed

MeSH terms

  NODES
twitter 2