. 2021 Sep 17:12:740976.
doi: 10.3389/fpls.2021.740976. eCollection 2021.

Overexpression of NtCBL5A Leads to Necrotic Lesions by Enhancing Na+ Sensitivity of Tobacco Leaves Under Salt Stress

Affiliations

Overexpression of NtCBL5A Leads to Necrotic Lesions by Enhancing Na+ Sensitivity of Tobacco Leaves Under Salt Stress

Jingjing Mao et al. Front Plant Sci. .

Abstract

Many tobacco (Nicotiana tabacum) cultivars are salt-tolerant and thus are potential model plants to study the mechanisms of salt stress tolerance. The CALCINEURIN B-LIKE PROTEIN (CBL) is a vital family of plant calcium sensor proteins that can transmit Ca2+ signals triggered by environmental stimuli including salt stress. Therefore, assessing the potential of NtCBL for genetic improvement of salt stress is valuable. In our studies on NtCBL members, constitutive overexpression of NtCBL5A was found to cause salt supersensitivity with necrotic lesions on leaves. NtCBL5A-overexpressing (OE) leaves tended to curl and accumulated high levels of reactive oxygen species (ROS) under salt stress. The supersensitivity of NtCBL5A-OE leaves was specifically induced by Na+, but not by Cl-, osmotic stress, or drought stress. Ion content measurements indicated that NtCBL5A-OE leaves showed sensitivity to the Na+ accumulation levels that wild-type leaves could tolerate. Furthermore, transcriptome profiling showed that many immune response-related genes are significantly upregulated and photosynthetic machinery-related genes are significantly downregulated in salt-stressed NtCBL5A-OE leaves. In addition, the expression of several cation homeostasis-related genes was also affected in salt-stressed NtCBL5A-OE leaves. In conclusion, the constitutive overexpression of NtCBL5A interferes with the normal salt stress response of tobacco plants and leads to Na+-dependent leaf necrosis by enhancing the sensitivity of transgenic leaves to Na+. This Na+ sensitivity of NtCBL5A-OE leaves might result from the abnormal Na+ compartmentalization, plant photosynthesis, and plant immune response triggered by the constitutive overexpression of NtCBL5A. Identifying genes and pathways involved in this unusual salt stress response can provide new insights into the salt stress response of tobacco plants.

Keywords: CBL PROTEIN; Na+; immune response; necrotic lesions; photosystem; reactive oxygen species; salt stress; tobacco.


Conflict of interest statement

The authors declare that the research was conducted in the absence of any commercial or financial relationships that could be construed as a potential conflict of interest.

Figures

Figure 1
Figure 1
Structure and phylogenetic relationship of NtCBL5A. (A) Amino acid sequence of NtCBL5A and the positions of four EF-hands predicted by SMART. (B) The 3D structure of NtCBL5A predicted by SWISS-MODEL. (C) Phylogenetic analysis of NtCBL5A and all known CBL members from Arabidopsis thaliana, Oryza sativa, and Solanum lycopersicum. The amino acid sequences of AtCBLs, OsCBLs, and SlCBLs were downloaded from TAIR (https://www.arabidopsis.org/), NCBI (https://www.ncbi.nlm.nih.gov/), and Sol Genomics Network (https://solgenomics.net/), respectively. The phylogenetic tree was constructed by MEGA6 using the Neighbor-Joining method.
Figure 2
Figure 2
The expression profile of NtCBL5A in tobacco plants. (A) The expression profile detection in different tissues by semi-quantitative RT-PCR at 30days after germination (DAG), L25 is the reference gene (Schmidt and Delaney, 2010). (B-F) The GUS staining of different tissues of ProNtCBL5A::GUS plants at different growth stages. They are seedlings at 3 DAG (B), seedlings at 5 DAG (C), seedlings at 20 DAG (D), leaves of the seedlings at 40 DAG (E), and stem and root tissues of the seedlings at 40 DAG (F), respectively.
Figure 3
Figure 3
The detection of NtCBL5A expression and above-ground phenotype of wild-type (WT) and NtCBL5A-overexpressing (OE) lines (OE-2 and OE-15) under control conditions and salt stress (100mM NaCl). Scale bars=10cm. (A) Relative expression analysis of endogenous NtCBL5A (the NtCBL5A driven by 35S promoter) determined by RT-qPCR in different tissues of tobacco seedlings at 4days after the start of treatment (DAT). The expression of NtCBL5A is relative to the reference gene L25 and the seedlings are 30-DAG old. (B,C) Relative expression analysis of endogenous NtCBL5A and exogenous NtCBL5A (the NtCBL5A driven by its own promoter in tobacco) determined by RT-qPCR in whole plants. The expression of NtCBL5A is relative to the reference gene L25 and the seedlings are 12-DAG old. The reverse primer pCHF3-Allcheck-1 used for amplifying exogenous NtCBL5A was designed according to the sequence of the overexpression vector pCHF3, referring to pCHF3-Allcheck-2 (Shi et al., 2021). (D) The shoot phenotype of WT and NtCBL5A-OE lines at 9 DAT. (E,F) The shoot fresh weight and dry weight of WT and NtCBL5A-OE lines at 9 DAT. Error bars indicate ±SD (n=3 for gene expression detection, n=17 for shoot fresh/dry weight determination), different letters above bars (a, b, and c) indicate significant statistical difference based on one-way ANOVA with LSD test (p<0.05).
Figure 4
Figure 4
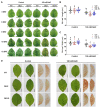
The determination of physiological parameters in wild-type (WT) and NtCBL5A-overexpressing lines (OE-2 and OE-15). (A) The phenotype of the fifth leaf of WT and NtCBL5A-OE lines under control conditions and salt stress (100mM NaCl) from 4 to 13 DAT. (B,C) Leaf length and leaf width determination of the fifth leaf at 8 DAT. (D) DAB staining of tobacco under control conditions and salt stress (100mM NaCl) at 6 DAT. Error bars indicate ±SD (n=17), different letters above bars (a, b, and c) indicate significant statistical difference based on one-way ANOVA with LSD test (p<0.05). Scale bars=2cm.
Figure 5
Figure 5
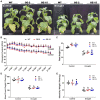
Phenotypic analysis of WT and NtCBL5A-OE lines (OE-2 and OE-15) under control conditions and drought stress. Scale bars=30cm. (A) The phenotype of WT and NtCBL5A-OE lines under control conditions and drought stress at 21DAT and 64DAG. (B) The chlorophyll content of the eigth leaf of WT and NtCBL5A-OE lines from 3 to 21 DAT. (C–E) The plant height, fresh shoot biomass, and dry shoot biomass of WT and NtCBL5A-OE lines at 21 DAT. Error bars indicate ±SD (n=4), different letters above bars (a, b, and c) indicate significant statistical difference based on one-way ANOVA with LSD test (p<0.05).
Figure 6
Figure 6
Ion and osmotic stress evaluation on WT and NtCBL5A-overexpressing lines (OE-2 and OE-15) at 9DAT. (A) The phenotype of WT and NtCBL5A-OE lines under control condition (1/2 Hoagland’s nutrient solution). (B) The phenotype of WT and NtCBL5A-OE lines under osmotic stress (1/2 Hoagland’s nutrient solution added 15% PEG6000). (C–F) The phenotype of WT and NtCBL5A-OE lines under ion stresses (1/2 Hoagland’s nutrient solutions added 100mM NaCl, 100mM NaNO3, 100mM KCl, and 100mM KNO3, respectively). Scale bars=10cm. Fourth leaves under light (Light), covered by aluminum-foil paper (Covered), and under dark (Dark), which were zoomed in at the right part of the panel.
Figure 7
Figure 7
Na+ and Cl contents in WT and NtCBL5A-overexpressing lines (OE-2 and OE-15) under control conditions and salt stress (100mM NaCl). (A,C) Na+ and Cl contents in the fifth leaf blades (with main veins removed) at 4, 6, and 9 DAT. (B,D) Na+ and Cl contents in different tissues (leaf blades: all leaves with main veins removed; main veins: main veins from all leaves; stems; and roots) at 10 DAT. C means control conditions, while S means salt stress. Error bars indicate ±SD (n=3), every biological replication is a mixed pool of three plants. One-way ANOVA with LSD test (*p<0.05 and **p<0.01) was used to analyze statistical significance.
Figure 8
Figure 8
The analysis of leaf transcriptome data of WT and the NtCBL5A-overexpressing line (OE-2) at 4 DAT. (A) Venn diagram with four up-regulated gene sets: Experiment 1 (Exp1)-C-WT/C-OE2, Exp 1-S-WT/S-OE2, Exp 2-C-WT/C-OE2, and Exp 2-S-WT/S-OE2. (B) Venn diagram with four upregulated gene sets: Exp1-C-WT/S-WT, Exp 1-C-OE2/S-OE2, Exp 2-C-WT/S-WT, and Exp 2-C-OE2/S-OE2. (C) Venn diagram with two sets: OE-affected upregulated differentially expressed genes (DEGs) and Salt-affected upregulated DEGs. (D) Venn diagram with four downregulated gene sets: Exp 1-C-WT/C-OE2, Exp 1-S-WT/S-OE2, Exp 2-C-WT/C-OE2, and Exp 2-S-WT/S-OE2. (E) Venn diagram with four downregulated gene sets: Exp 1-C-WT/S-WT, Exp 1-C-OE2/S-OE2, Exp 2-C-WT/S-WT, and Exp 2-C-OE2/S-OE2. (F) Venn diagram with two sets: OE-affected down-regulated DEGs and Salt-affected downregulated DEGs. (G,H) Kyoto encyclopedia of genes and genomes (KEGG) enrichment of upregulated genes and downregulated genes. The pathways labeled in blue were significantly enriched pathways. Count: the number of DEGs, bigger circle means more DEGs number; GeneRatio: the number of DEGs/the total number of genes in this pathway; padj: p, padj<0.05 means significant difference, redder color means greater significance. The raw data of RNA-seq can be found in GEO data repository with the accession number GSE181164, in which samples were named as C-WT-1, S-WT-1, C-OE2-1, S-OE2-1, C-WT-2, S-WT-2, C-OE2-2, and S-OE2-2. “C” refers to “Control,” “S” refers to “Salt,” “WT” refers to “wild-type,” “OE2” refers to the OE2 line of NtCBL5A-overexpressing lines, “1” refers to “Experiment 1,” and “2” refers to “Experiment 2.”
Figure 9
Figure 9
Relative expression analysis of plant defense-related marker genes, Na+ homeostasis- and Ca2+ homeostasis-related genes determined by RT-qPCR in tobacco leaves. (A-L) The expression of these genes is relative to the reference gene L25 under control conditions and salt stress (100mM NaCl) at 4days after the start of treatment. Their gene IDs in the reference tobacco genome database (ftp://ftp.solgenomics.net/genomes/Nicotiana_tabacum/edwards_et_al_2017/assembly/Nitab-v4.5_genome_Chr_Edwards2017.fasta.gz) are N-RICH PROTEIN (NRP; Nitab4.5_0000798g0120), HSR203J (Nitab4.5_0002719g0120), PR-Q (Nitab4.5_0003207g0080), PR1a (Nitab4.5_0003771g0010), PR1b (Nitab4.5_0005400g0020), PR1c (Nitab4.5_0004861g0040), PR-R minor (Nitab4.5_0004097g0050), PR-R major (Nitab4.5_0000360g0100), Cation/H+ EXCHANGER 18 (CHX18; Nitab4.5_0006998g0030), Na+/Ca2+ EXCHANGER 1 (NCX1; Nitab4.5_0005404g0030), CATION/PROTON 3 (CAX3; Nitab4.5_0000102g0080), and CNGC1 (Nitab4.5_0000258g0120). Error bars indicate ±SD (n=3). One-way ANOVA with LSD test (*p<0.05 and **p<0.01) was used to analyze statistical significance.
Figure 10
Figure 10
Relative expression analysis of photosynthesis-related genes determined by RT-qPCR in tobacco leaves. (A-L) The expression of these genes is relative to the reference gene L25 under control conditions and salt stress (100mM NaCl) at 4DAT. Their gene IDs in the reference tobacco genome database (ftp://ftp.solgenomics.net/genomes/Nicotiana_tabacum/edwards_et_al_2017/assembly/Nitab-v4.5_genome_Chr_Edwards2017.fasta.gz) are PsaH (Nitab4.5_0000351g0060), PsaE (Nitab4.5_0000385g0230), PsaD (Nitab4.5_0014875g0010), PsbQ (Nitab4.5_0002345g0070), PsbX (Nitab4.5_0000073g0060), OXYGEN EVOLVING ENHANCER PROTEIN 1 (OEE1; Nitab4.5_0000108g0110), LIGHT-HARVESTING CHLOROPHYLL PROTEIN COMPLEX (Lhca3; Nitab4.5_0000923g0200), Lhcb3 (Nitab4.5_0012832g0010), Lhcb4 (Nitab4.5_0011597g0020), Fd (Nitab4.5_0004129g0010), F-ATPase delta subunit (Nitab4.5_0006745g0030), and GLYCERALDEHYDE-3-PHOSPHATE DEHYDROGENASE A (GAPA; Nitab4.5_0010299g0040). Error bars indicate ±SD (n=3). One-way ANOVA with LSD test (*p<0.05 and **p<0.01) was used to analyze statistical significance.

Similar articles

Cited by

References

    1. Aleman F., Nieves-Cordones M., Martinez V., Rubio F. (2011). Root K+ acquisition in plants: the Arabidopsis thaliana model. Plant Cell Physiol. 52, 1603–1612. doi: 10.1093/pcp/pcr096, PMID: - DOI - PubMed
    1. An L. L., Mao J. J., Che H. Y., Shi S. J., Dong L. H., Xu D. Z., et al. . (2020). Screening and identification of NsylCBL family members interacting with protein kinase NsylCIPK24a in Nicotiana Sylvestris. Mol. Plant Breed. 11, 1–10. doi: 10.5376/pgt.2020.10.0005 - DOI
    1. Attia H., Karray N., Lachaâl M. (2009). Light interacts with salt stress in regulating superoxide dismutase gene expression in Arabidopsis. Plant Sci. 177, 161–167. doi: 10.1016/j.plantsci.2009.05.002 - DOI
    1. Bartels D., Sunkar R. (2005). Drought and salt tolerance in plants. CRC Crit. Rev. Plant Sci. 24, 23–58. doi: 10.1080/07352680590910410 - DOI
    1. Bruggeman Q., Raynaud C., Benhamed M., Delarue M. (2015). To die or not to die? Lessons from lesion mimic mutants. Front. Plant Sci. 6:24. doi: 10.3389/fpls.2015.00024, PMID: - DOI - PMC - PubMed
  NODES
Project 1
twitter 2