. 2021 Nov;9(11):e002837.
doi: 10.1136/jitc-2021-002837.

DPP inhibition alters the CXCR3 axis and enhances NK and CD8+ T cell infiltration to improve anti-PD1 efficacy in murine models of pancreatic ductal adenocarcinoma

Affiliations

DPP inhibition alters the CXCR3 axis and enhances NK and CD8+ T cell infiltration to improve anti-PD1 efficacy in murine models of pancreatic ductal adenocarcinoma

Allison A Fitzgerald et al. J Immunother Cancer. 2021 Nov.

Abstract

Background: Pancreatic ductal adenocarcinoma (PDAC) is projected to be the second leading cause of cancer death in the USA by 2030. Immune checkpoint inhibitors fail to control most PDAC tumors because of PDAC's extensive immunosuppressive microenvironment and poor immune infiltration, a phenotype also seen in other non-inflamed (ie, 'cold') tumors. Identifying novel ways to enhance immunotherapy efficacy in PDAC is critical. Dipeptidyl peptidase (DPP) inhibition can enhance immunotherapy efficacy in other cancer types; however, the impact of DPP inhibition on PDAC tumors remains unexplored.

Methods: We examined the effects of an oral small molecule DPP inhibitor (BXCL701) on PDAC tumor growth using mT3-2D and Pan02 subcutaneous syngeneic murine models in C57BL/6 mice. We explored the effects of DPP inhibition on the tumor immune landscape using RNAseq, immunohistochemistry, cytokine evaluation and flow cytometry. We then tested if BXCL701 enhanced anti-programmed cell death protein 1 (anti-PD1) efficacy and performed immune cell depletion and rechallenged studies to explore the relevance of cytotoxic immune cells to combination treatment efficacy.

Results: In both murine models of PDAC, DPP inhibition enhanced NK and T cell immune infiltration and reduced tumor growth. DPP inhibition also enhanced the efficacy of anti-PD1. The efficacy of dual anti-PD1 and BXCL701 therapy was dependent on both CD8+ T cells and NK cells. Mice treated with this combination therapy developed antitumor immune memory that cleared some tumors after re-exposure. Lastly, we used The Cancer Genome Atlas (TCGA) to demonstrate that increased NK cell content, but not T cell content, in human PDAC tumors is correlated with longer overall survival. We propose that broad DPP inhibition enhances antitumor immune response via two mechanisms: (1) DPP4 inhibition increases tumor content of CXCL9/10, which recruits CXCR3+ NK and T cells, and (2) DPP8/9 inhibition activates the inflammasome, resulting in proinflammatory cytokine release and Th1 response, further enhancing the CXCL9/10-CXCR3 axis.

Conclusions: These findings show that DPP inhibition with BXCL701 represents a pharmacologic strategy to increase the tumor microenvironment immune cell content to improve anti-PD1 efficacy in PDAC, suggesting BXCL701 can enhance immunotherapy efficacy in 'cold' tumor types. These findings also highlight the potential importance of NK cells along with T cells in regulating PDAC tumor growth.

Keywords: combination; drug evaluation; drug therapy; immunotherapy; preclinical; programmed cell death 1 receptor; th1-th2 balance.


Conflict of interest statement

Competing interests: LMW received research funding from BioXcel Therapeutics.

Figures
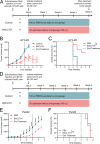
Figure 1
Figure 1
DPP inhibition reduces murine PDAC tumor growth. (A) Schematic representation of in vivo experimental design testing BXCL701 treatment vs PBS controls in mT3-2D PDAC tumors. (B) Average mT3-2D tumor growth curves in C57BL/6 mice (n=10 per group) treated with PBS control or BXCL701 for 4 weeks. Dashed line represents the end of treatment. Tumor growth was monitored weekly. (Data represented as mean±SEM. *p<0.05 as determined by two-tailed unpaired t-test). (C) Survival curves of C57BL/6 mice (n=10 per group) treated with PBS control or BXCL701 for 4 weeks. Dashed line represents the end of treatment. (**p<0.01 as determined by log-rank (Mantel-Cox) test). (D) Schematic representation of in vivo experimental design testing BXCL701 treatment vs PBS controls in Pan02 PDAC tumors. (E) Average Pan02 tumor growth curves in C57BL/6 mice (n=10 per group) treated with PBS control or BXCL701. Tumor growth was monitored twice weekly. (Data represented as mean±SEM. *p<0.05, **p<0.01, ***p<0.001, ****p<0.0001 as determined by two-tailed unpaired t-test). (F) Survival curves of C57BL/6 mice (n=10 per group) treated with PBS control or BXCL701 for 4 weeks. Dashed line represents the end of treatment. (ns=nonsignificant as determined by log-rank (Mantel-Cox) test). DPP, dipeptidyl peptidase; PBS, phosphate-buffered saline; PDAC, pancreatic ductal adenocarcinoma.
Figure 2
Figure 2
BXCL701 increases circulating inflammasome and Th1-related cytokines. (A) Heatmap showing average fold change of serum cytokine concentration of BXCL701-treated mice bearing Pan02 or mT3-2D tumors compared with PBS-treated controls. For the Pan02 sera, each value is the average of three triplicates. For the mT3-2D sera, each value is a single measurement of sera pooled from three to four mice. Th1 and inflammasome-related cytokines are bolded. (B) Serum concentration of inflammasome-related cytokines in mice bearing Pan02 tumors. Day 1 concentrations were compared with 0 timepoint. Day 7 and 14 concentrations were compared with vehicle. (n=3 mice/group, *p<0.05, **p<0.01, ***p<0.001, ****p<0.0001 calculated by ANOVA then Dunnett’s multiple comparison test, NM=not measured). (C) Serum concentration of Th1-related cytokines in mice bearing Pan02 tumors. Day 1 concentrations were compared with 0 timepoint. Day 7 and 14 concentrations were compared with vehicle. (n=3 mice/group, *p<0.05, ***p<0.001 calculated by ANOVA then Dunnett’s multiple comparison test, NM=not measured). ANOVA, analysis of variance; PBS, phosphate-buffered saline.
Figure 3
Figure 3
RNAseq analysis shows that BXCL701 treatment upregulates CXCL9, Th1 response and NK and CD8 + T cell genes in Pan02 tumors. (A) Heatmap showing genes that are differentially expressed between BXCL701 and vehicle control at 14 days for all treatment groups and times (false discovery rate (FDR)-adjusted p value <0.05, absolute log fold change greater than 1). (B) Pathways with statistically significant over-representation between by BXCL701 treatment and vehicle control at 14 days. (C) Functional protein network from genes differentially expressed between BXCL701 and vehicle control at 14 days, created by STRING analysis.
Figure 4
Figure 4
BXCL701 increases tumor levels of chemoattractants CXCL9/10 and CXCR3 + cells. (A) Heatmap showing average fold change of cytokine concentration in mT3-2D tumors treated with BXCL701. Each value is the average from two timepoints: week 4 and week 5 of treatment. Each timepoint consisted of three to four pooled tumors. (B) Representative IHC images and quantification of CXCR3+ staining in tumors treated with PBS or BXCL701 for 4 weeks. Each point represents the average value from one tumor. (*p<0.05 as determined by unpaired two-tailed t-test). (C) Representative IHC images of CD4+, CD8+ and NKp46+ staining in tumors treated with PBS or BXCL701. (D) Quantification of CD4+, CD8+ and NKp46+ staining in tumors treated with PBS or BXCL701 for 7 days and 28 days. Each point represents one tumor/mouse. (ns=nonsignificant, *p<0.05, **p<0.01, ***p<0.001, ****p<0.0001 as determined by unpaired two-tailed t-test). IHC, immunohistochemistry; PBS, phosphate-buffered saline.
Figure 5
Figure 5
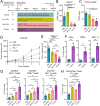
BXCL701 treatment enhances anti-PD1 efficacy in mT3-2D tumors. (A) Schematic representation of in vivo experimental design testing combination treatment of BXCL701 and anti-PD1 vs single agents alone and PBS controls in mT3-2D tumors. (B) DPP activity measured in the serum of PBS, anti-PD1, BXCL701 or anti-PD1 and BXCL701 (‘Combo’) treated mice (n=5 per group, each dot representing pooled serum from three mice, **p<0.01, ***p<0.001, ****p<0.0001 as determined by ANOVA followed by Tukey’s multiple comparison’s test, any pairwise comparisons not shown were not significant). (C) DPP activity measured in the tumor lysates of PBS, anti-PD1, BXCL701 and combo-treated mice (n=3 per group,*p<0,05 as determined by ANOVA followed by Tukey’s multiple comparison’s test, any pairwise comparisons not shown were not significant). (D) Average mT3-2D tumor growth curves in C57BL/6 mice (n=15 per group) treated with PBS, anti-PD1, BXCL701 and combo. Tumor growth was monitored weekly. (E) Tumor volumes for PBS, anti-PD1, BXCL701 and combo-treated mT3-2D tumors at the end of treatment (week 4). (***p<0.001, ns=nonsignificant as determined by ANOVA followed by Tukey’s multiple comparison’s test). (F) Flow cytometry data representing CD4+, CD8+ and NK1.1+ cells as percent of live cells in tumors collected from PBS andcombo-treated mice (n=3 per group, each dot representing three to four tumors from individual mice, *p<0.05, **p<0.01, as determined by unpaired two-tailed t-test). (G) Flow cytometry data representing percentage of live cells that are CXCR3+CD4+, CXCR3+CD8+ and CXCR3+NK1.1+ cells in tumors from PBS, anti-PD-1, BXCL701 and combo treated mice (n=3 per group, each dot representing three to four tumors from individual mice, *p<0.05, **p<0.01, ***p<0.001, ns=nonsignificant as determined by one-way ANOVA followed by Tukey’s multiple comparison test). (H) Flow cytometry data representing percentage of live cells that are CD4 +IFNγ+Tbet+ Th1 cells in tumors from PBS, anti-PD-1, BXCL701 and combo treated mice (n=3 per group, each dot representing three to four tumors from individual mice, *p<0.05, **p<0.01, ***p<0.001, ****p<0.0001, ns=nonsignificant as determined by one-way ANOVA followed by Tukey’s multiple comparison test). ANOVA, analysis of variance; DPP, dipeptidyl peptidase; PBS, phosphate-buffered saline.
Figure 6
Figure 6
BXCL701 +anti-PD1 combination treatment is dependent on both CD8+ T cells and NK cells. (A) Schematic representation of in vivo experiment design testing effect of CD8+ T cell and NK cell depletion on combination treatment (BXCL701 +anti-PD1) efficacy in mT3-2D tumors. (B) Average mT3-2D tumor growth curves in C57BL/6 mice treated with PBS (n=10), BXCL701 +anti-PD1 combination (n=10), combination with NK1.1+ NK cell depletion (n=5), combination with CD8+ T cell depletion (n=5), or combination with NK1.1+ NK cell depletion and CD8+ T cell depletion (n=5). Tumor growth was monitored weekly. (C) Tumor volumes after 4 weeks of treatment (day 32) for mT3-2D tumors treated with PBS, BXCL701+anti-PD1 combination (‘Combo’), combo with NK1.1+cell depletion, combo with CD8 + T cell depletion or combo with both NK1.1+ and CD8+ T cell depletion. (ns=non-significant, **p<0.01,***p<0.001, ****p<0.0001 as determined by analysis of variance followed by Tukey’s multiple comparison’s test). (D) Individual tumor growth curves for treatment-naive C57BL/6 mice (n=5) and previously ‘cured’ C57BL/6 mice (n=13) injected with 5×10⁵ mT3-2D cells. Tumor growth was monitored three times a week. (E) mT3-2D tumor volumes in treatment-naive C57BL/6 mice and previously ‘cured’ C57BL/6 mice 40 days after injection of 5×10⁵ mT3-2D cells. (****p<0.0001 by unpaired two-tailed t-test). PBS, phosphate-buffered saline.
Figure 7
Figure 7
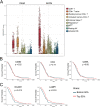
NK cell marker mRNA levels are increased in human pancreatic cancer tumors and predictive of survival. (A) CIBERSORT scores representing the relative abundance of various immune cell types derived from RNAseq data from TCGA for pancreatic adenocarcinoma (PAAD) and skin cutaneous melanoma (SKCM). (B) Overall survival curves demonstrating there is no significant difference in survival in TCGA PDAC patients with high (top 50%) vs low (bottom 50%) mRNA expression levels of T cell markers (CD3, CD4 and CD8A). (C) Overall survival curves demonstrating TCGA PDAC patients with high levels (top 50%) of NK cell marker CD56 and NK cell activation marker LAMP1 have significantly longer overall survival compared with PDAC patients with low expression (bottom 50%) of CD56 or LAMP1. PDAC, pancreatic ductal adenocarcinoma; TCGA, The Cancer Genome Atlas.

Similar articles

Cited by

References

    1. Sarantis P, Koustas E, Papadimitropoulou A, et al. . Pancreatic ductal adenocarcinoma: treatment hurdles, tumor microenvironment and immunotherapy. World J Gastrointest Oncol 2020;12:173–81. 10.4251/wjgo.v12.i2.173 - DOI - PMC - PubMed
    1. Society AC . Cancer facts & figures 20221 [online]. Available: https://www.cancer.org/content/dam/cancer-org/research/cancer-facts-and-...
    1. Le DT, Durham JN, Smith KN, et al. . Mismatch repair deficiency predicts response of solid tumors to PD-1 blockade. Science 2017;357:409–13. 10.1126/science.aan6733 - DOI - PMC - PubMed
    1. O'Reilly EM, Oh D-Y, Dhani N, et al. . Durvalumab with or without tremelimumab for patients with metastatic pancreatic ductal adenocarcinoma: a phase 2 randomized clinical trial. JAMA Oncol 2019;5:1431–8. 10.1001/jamaoncol.2019.1588 - DOI - PMC - PubMed
    1. Osipov A, Zaidi N, Laheru DA. Dual checkpoint inhibition in pancreatic cancer: revealing the limitations of synergy and the potential of novel combinations. JAMA Oncol 2019;5:1438–9. 10.1001/jamaoncol.2019.1583 - DOI - PubMed

Publication types

MeSH terms

Substances

  NODES
Project 2
twitter 2