Albino mice with the point mutation at the tyrosinase locus show high cholesterol diet-induced NASH susceptibility
- PMID: 34750345
- PMCID: PMC8576022
- DOI: 10.1038/s41598-021-00501-5
Albino mice with the point mutation at the tyrosinase locus show high cholesterol diet-induced NASH susceptibility
Abstract
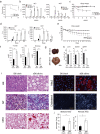
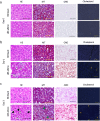
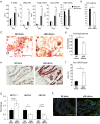
Non-alcoholic fatty liver disease (NAFLD) constitutes a metabolic disorder with high worldwide prevalence and increasing incidence. The inflammatory progressive state, non-alcoholic steatohepatitis (NASH), leads to liver fibrosis and carcinogenesis. Here, we evaluated whether tyrosinase mutation underlies NASH pathophysiology. Tyrosinase point-mutated B6 (Cg)-Tyrc-2J/J mice (B6 albino) and C57BL/6J black mice (B6 black) were fed with high cholesterol diet (HCD) for 10 weeks. Normal diet-fed mice served as controls. HCD-fed B6 albino exhibited high NASH susceptibility compared to B6 black, a phenotype not previously reported. Liver injury occurred in approximately 50% of B6 albino from one post HCD feeding, with elevated serum alanine aminotransferase and aspartate aminotransferase levels. NASH was induced following 2 weeks in severe-phenotypic B6 albino (sB6), but B6 black exhibited no symptoms, even after 10 weeks. HCD-fed sB6 albino showed significantly higher mortality rate. Histological analysis of the liver revealed significant inflammatory cell and lipid infiltration and severe fibrosis. Serum lipoprotein analysis revealed significantly higher chylomicron and very low-density lipoprotein levels in sB6 albino. Moreover, significantly higher small intestinal lipid absorption and lower fecal lipid excretion occurred together with elevated intestinal NPC1L1 expression. As the tyrosinase point mutation represents the only genetic difference between B6 albino and B6 black, our work will facilitate the identification of susceptible genetic factors for NASH development and expand the understanding of NASH pathophysiology.
© 2021. The Author(s).
Conflict of interest statement
The authors declare no competing interests.
Figures


Similar articles
-
Cellular cholesterol accumulation modulates high fat high sucrose (HFHS) diet-induced ER stress and hepatic inflammasome activation in the development of non-alcoholic steatohepatitis.Biochim Biophys Acta. 2016 Jul;1861(7):594-605. doi: 10.1016/j.bbalip.2016.04.005. Epub 2016 Apr 14. Biochim Biophys Acta. 2016. PMID: 27090939
-
Hepatoprotective Effects of a Novel Trihoney against Nonalcoholic Fatty Liver Disease: A Comparative Study with Atorvastatin.ScientificWorldJournal. 2020 Oct 9;2020:4503253. doi: 10.1155/2020/4503253. eCollection 2020. ScientificWorldJournal. 2020. PMID: 33132768 Free PMC article.
-
Temporal Development of Dyslipidemia and Nonalcoholic Fatty Liver Disease (NAFLD) in Syrian Hamsters Fed a High-Fat, High-Fructose, High-Cholesterol Diet.Nutrients. 2021 Feb 12;13(2):604. doi: 10.3390/nu13020604. Nutrients. 2021. PMID: 33673227 Free PMC article.
-
Overactivation of intestinal sterol response element-binding protein 2 promotes diet-induced nonalcoholic steatohepatitis.Am J Physiol Gastrointest Liver Physiol. 2017 Nov 1;313(5):G376-G385. doi: 10.1152/ajpgi.00174.2017. Epub 2017 Aug 3. Am J Physiol Gastrointest Liver Physiol. 2017. PMID: 28774869 Free PMC article.
-
Strain dependence of diet-induced NASH and liver fibrosis in obese mice is linked to diabetes and inflammatory phenotype.Liver Int. 2014 Aug;34(7):1084-93. doi: 10.1111/liv.12335. Epub 2013 Oct 25. Liver Int. 2014. PMID: 24107103
Cited by
-
Natto consumption suppresses atherosclerotic plaque progression in LDL receptor-deficient mice transplanted with iRFP-expressing hematopoietic cells.Sci Rep. 2023 Dec 18;13(1):22469. doi: 10.1038/s41598-023-48562-y. Sci Rep. 2023. PMID: 38110459 Free PMC article.
References
Publication types
MeSH terms
Substances
Grants and funding
LinkOut - more resources
Full Text Sources
Other Literature Sources
Medical
Research Materials

