. 2021 Dec 3;17(12):e1010098.
doi: 10.1371/journal.ppat.1010098. eCollection 2021 Dec.

H9N2 virus-derived M1 protein promotes H5N6 virus release in mammalian cells: Mechanism of avian influenza virus inter-species infection in humans

Affiliations

H9N2 virus-derived M1 protein promotes H5N6 virus release in mammalian cells: Mechanism of avian influenza virus inter-species infection in humans

Fangtao Li et al. PLoS Pathog. .

Abstract

H5N6 highly pathogenic avian influenza virus (HPAIV) clade 2.3.4.4 not only exhibits unprecedented intercontinental spread in poultry, but can also cause serious infection in humans, posing a public health threat. Phylogenetic analyses show that 40% (8/20) of H5N6 viruses that infected humans carried H9N2 virus-derived internal genes. However, the precise contribution of H9N2 virus-derived internal genes to H5N6 virus infection in humans is unclear. Here, we report on the functional contribution of the H9N2 virus-derived matrix protein 1 (M1) to enhanced H5N6 virus replication capacity in mammalian cells. Unlike H5N1 virus-derived M1 protein, H9N2 virus-derived M1 protein showed high binding affinity for H5N6 hemagglutinin (HA) protein and increased viral progeny particle release in different mammalian cell lines. Human host factor, G protein subunit beta 1 (GNB1), exhibited strong binding to H9N2 virus-derived M1 protein to facilitate M1 transport to budding sites at the cell membrane. GNB1 knockdown inhibited the interaction between H9N2 virus-derived M1 and HA protein, and reduced influenza virus-like particles (VLPs) release. Our findings indicate that H9N2 virus-derived M1 protein promotes avian H5N6 influenza virus release from mammalian, in particular human cells, which could be a major viral factor for H5N6 virus cross-species infection.


Conflict of interest statement

The authors have declared that no competing interests exist.

Figures

Fig 1
Fig 1. Phylogenetic analysis of H5N6 viruses.
(A) Phylogenetic analysis of H5N6 viruses in China. The clade origins of each internal gene are indicated by different colored bars. Detailed phylogenetic trees are available as S1 Fig and S1 Table. H5N6 human strains are marked as red circles, virus labeled with a red asterisk was used in the present research. (B) Frequencies of H5N6 viruses carrying H9N2 virus-derived internal genes of human and avian origin.
Fig 2
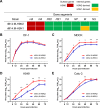
Fig 2. Reassortment of the H9N2 virus-derived M gene enhanced H5N6 virus replication in mammalian cells.
(A) Gene origins of rM14:M-H9N2 and rM14:M-H5N1 viruses. (B-E) Multistep growth curves of rM14:M-H9N2 and rM14:M-H5N1 viruses in DF-1, MDCK, A549 and Calu-3 cells, respectively (MOI of 0.01). Virus titers were determined from the supernatants collected at the indicated time points. Statistical significance was based on one-way ANOVA (*, P < 0.05; **, P < 0.01).
Fig 3
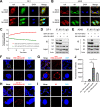
Fig 3. H9N2 virus-derived M1 protein strongly bound HA protein in mammalian cells.
(A-B) DF-1 or A549 cells were infected with rM14:M-H5N1 or rM14:M-H9N2 viruses at an MOI of 1. Confocal microscopy was performed to detect H5N6 HA and M1 protein localization in cells (green and red fluorescence resulting in a yellow color denote colocalization). (C) The dynamic colocalization 24 h post-transfection as observed via live imaging of H9N2 virus-derived eGFP-M1/BFP-HA or H5N1-derived eGFP-M1/BFP-HA transfected A549 cells. Pearson’s coefficients were analyzed in co-localized volume between eGFP-M1 and BFP-HA located at the membrane in 36-time frames (1-time frame duration = 42.62 s). (D–E) Physical interaction of viral M1 and HA proteins in cells. (D) DF-1 or (E) A549 cells separately infected with rM14:M-H5N1 and rM14:M-H9N2 viruses at an MOI of 1. At 24 hpi, cell lysates were immunoprecipitated using anti-M1 antibody or anti-IgG antibody, followed by Western blotting for influenza M1 and HA proteins. In A549 cells, an increased binding ability was observed between H9N2-derived M1 and HA proteins than between H5N1-derived M1 and HA proteins. IB, immunoblot. (F–H) interaction between influenza HA and M1 protein was determined by proximity ligation assay. 293T cells were co-transfected with (F) H5 HA and H5N1-derived M1, (G) H5 HA and H9N2-derived M1, (H) H3 HA and H3N2-derived M1, or (I) empty vector as negative control (NC). 24 h post transfection, PLA was performed using antibodies specific to influenza M1 and HA proteins. Fluorescence of cells was analyzed by a fluorescence confocal microscope (red fluorescent signal). Nuclei were stained with DAPI (blue). (J) Multiple images (F–I) were processed by BlobFinder software to measure the PLA fluorescence intensity (~30 cells total for each condition). Graphs show the means ± SD of three independent experiments (*, P < 0.05; **, P < 0.01).
Fig 4
Fig 4. H9N2 virus-derived M1 protein increased viral progeny particle release in mammalian cells.
(A–C) IEM analysis of influenza VLPs in the concentrated cell culture supernatant. 293T cells were co-transfected with (A) HA and H5N1-derived M1, (B) HA and H9N2-derived M1, or (C) empty vector as negative control. Anti-H5N1 IAV HA antibody was used as the primary antibody. The gold is 10 nm in diameter. (D–I) Size and molecular profiling of eGFP-M1+ VLP particles via a Flow NanoAnalyzer. 293T cells were co-transfected with (D, G) HA and H5N1-derived eGFP-M1, (E, H) HA and H9N2-derived eGFP-M1, or (F, I) empty vector as negative control. eGFP was used to label the VLPs. Size profiling of the purified eGFP-M1+ VLP particles with the FITC channel, where Y-axis represents the events, and X-axis represents the size. (G–I) Molecular profiling of eGFP-M1+ VLP particles. SS-A, side scatter area.
Fig 5
Fig 5. GNB1 protein bound more strongly to H9N2 virus-derived M1 protein than to H5N1-derived M1 protein.
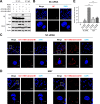
(A–D) Interaction between influenza M1 and endogenous GNB1 proteins was determined by PLA. 293T cells were transfected with (A) H5N1-derived M1 plasmid, (B) H9N2-derived M1 plasmid, (C) H3N2-derived M1 plasmid, or (D) empty vector as negative control. The PLA was performed using antibodies specific to influenza M1 and endogenous GNB1 proteins. The fluorescence of cells was analyzed by a fluorescence confocal microscope (red fluorescent signal). Nuclei were stained with DAPI (blue). (E) Multiple images (A–D) were processed by BlobFinder to measure the PLA fluorescence intensity per cell (~30 cells total for each condition). Graphs show means ± SD of three independent experiments (*, P < 0.05; **, P < 0.01).
Fig 6
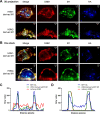
Fig 6. mCherry-GNB1 specifically co-localized with H9N2 virus-derived eGFP-M1 protein.
(A–B) Visualization of the single-channel images showing the localization of BFP-HA (blue), eGFP-M1 (green), and mCherry-GNB1 (red) in A549 cells, measured after co-transfecting H9N2-derived eGFP-M1/BFP-HA/mCherry-GNB1 or H5N1-derived eGFP-M1/BFP-HA/mCherry-GNB1 in (A) 3D projection or (B) one stack (Z-start: 0.0 μm, Z-end: 50.0 μm, Z-step: 0.5000 μm) using line profiles in image-analysis software platform Fiji. (C–D) The fluorescence intensity profile was plotted along the white arrow crossing the cell membrane in Fig 6B using ImageJ/Fiji software. The signal intensities (absolute gray values from 16-bit raw images) are plotted, where Y-axis shows the signal intensity, and X-axis shows the length of the line. The line profiles from three different channels are merged into one graph. Two different expression patterns are shown, highlighting the differences in the mCherry-GNB1 (red) and the similarities in the BFP-HA (blue) and eGFP-M1 (green) signal. Scale bars: 2 μm.
Fig 7
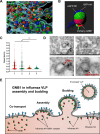
Fig 7. GNB1 protein co-transported with M1 protein in A549 cells.
(A) A549 cells were transfected with eGFP-M1, BFP-HA, and mCherry-GNB1 expression plasmids. Cross-section through the volume depicts the signal from the three channels. Yellow arrowheads indicate the co-localized puncta corresponding to co-transport of eGFP-M1 and mCherry-GNB1 to BFP-HA (S1 Movie). The blue, green, and red arrows or balls represent the tracks or punctas of BFP-HA, eGFP-M1, and mCherry-GNB1, respectively. (B) Enlarged view of the combination of H9N2-derived eGFP-M1, BFP-HA, and mCherry-GNB1. (C) Live-cell imaging illustrating the dynamic movement of the fluorescent fusion protein puncta within a cell with a similar number of spots and tracks between H9N2-derived eGFP-M1/BFP-HA/mCherry-GNB1 and H5N1-derived eGFP-M1/BFP-HA/mCherry-GNB1 transfected cells, which quantifies the track speed (ratio of track length to track duration [μm/s]) to characterize the intracellular movement. Each datapoint represents a punctum from the corresponding channel for the motion parameters (track speed) of eGFP-M1 singletons and mCherry-GNB1 singletons. “1” and “2” denote the speed of mCherry-GNB1 and H9N2-derived eGFP-M1 in H9N2-derived eGFP-M1/BFP-HA/mCherry-GNB1, respectively. “3” and “4” denote the speed of mCherry-GNB1 and H5N1-derived eGFP-M1 in H5N1-derived eGFP-M1/BFP-HA/mCherry-GNB1, respectively. (D) IEM analysis of influenza virus in the supernatant from infected cells. A549 cells were infected with rM14:M-H9N2 virus at an MOI of 1. At 24 hpi, supernatants from infected cells were collected for IEM. Anti-GNB1 or anti-influenza M1 antibody were used as the primary antibody. The gold is 10 nm in diameter. (E) Proposed model of the roles of GNB1 in viral assembly and budding of influenza VLPs.
Fig 8
Fig 8. GNB1 facilitated interaction between M1 and HA proteins in mammalian cells.
(A) A549 cells were transfected with NC siRNA or #297 siRNA and infected with recombinant H5N6 virus (rM14:M-H5N1 or rM14:M-H9N2). At 24 hpi, cell lysates were immunoprecipitated using an anti-influenza M1 antibody and probed with an anti-influenza HA antibody. Cell lysates of infected A549 cells were immunoprecipitated using an anti-IgG antibody and probed with an anti-influenza HA antibody as negative control. Compared to the normal cells, the interaction between H9N2-derived M1 and HA proteins was decreased in the GNB1-silenced cells. IB, immunoblot. (B–D) Influenza M1 and HA proteins interaction was determined by PLA. The PLA was performed using antibodies specific to influenza M1 and HA proteins. The fluorescence of cells was analyzed by a fluorescence confocal microscope (red fluorescent signal). Nuclei were stained with DAPI (blue). (B) PLA of the cells transfected with NC siRNA and an empty vector. (C) PLA of the cells transfected with NC siRNA, HA, and H9N2- or H5N1-derived M1 encoding plasmids. (D) PLA of the cells transfected with #297 siRNA, HA, and H9N2- or H5N1-derived M1 encoding plasmids. (E) Multiple images (B–D) were processed by BlobFinder to measure the PLA fluorescence intensity per cell (~30 cells total for each condition). The graphs show the means ± SD of three independent experiments normalized to the HA+H9N2-derived M1 (NC siRNA) PLA signal. (***, P < 0.001; ns, no significance.)
Fig 9
Fig 9. GNB1 protein contributed to viral particle release triggered by H9N2 virus-derived M1 protein.
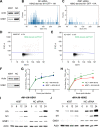
(A–E) Sizing and molecular profiling of VLP-associated H9N2-derived eGFP-M1 in #297 siRNA-induced GNB1-silenced or normal 293T cells. (A) A549 cells were transfected with siRNAs (_targeting GNB1 or negative control), and GNB1 protein expression level at 36 h post-transfection were determined by Western blotting. (B–C) Size profiling of H9N2-derived eGFP-M1+ VLP particles with the FITC channel. (D–E) Molecular profiling of H9N2-derived eGFP-M1+ VLP particles. SS-H, side scatter height. (F–J) GNB1 knockdown decreased rM14:M-H9N2 virus replication in A549 cells. (F) GNB1 protein expression level at 36 h post-transfection determined by Western blotting. A549 cells transfected with siRNAs (either NC or GNB1-_targeting siRNA #297) were infected with (G) rM14:M-H5N1 virus or (H) rM14:M-H9N2 virus at an MOI of 1. Viral titers were measured by TCID50 assay at the indicated time points. Each data is represented as means ± SD and represents three independent experiments. (**, P < 0.01; ***, P < 0.001; ns, no significance). A549 cells transfected with NC or GNB1-_targeting siRNA #297 were infected with (I) rM14:M-H5N1 virus or(J) rM14:M-H9N2 virus at an MOI of 1, and expression of HA and M1 protein was measured by Western blotting.

Similar articles

Cited by

References

    1. WHO. Cumulative number of confirmed human cases for avian influenza A(H5N1) reported to WHO. 2021. Available from: https://cdn.who.int/media/docs/default-source/influenza/human-animal-int....
    1. WHO. Human infection with avian influenza A(H5) viruses. 2021. Available from: https://www.who.int/docs/default-source/wpro—documents/emergency/surveil....
    1. Quan C, Shi W, Yang Y, Yang Y, Liu X, Xu W, et al.. New Threats from H7N9 Influenza Virus: Spread and Evolution of High- and Low-Pathogenicity Variants with High Genomic Diversity in Wave Five. Journal of Virology. 2018;92(11):e00301–18. doi: 10.1128/JVI.00301-18 - DOI - PMC - PubMed
    1. Li X, Shi J, Guo J, Deng G, Zhang Q, Wang J, et al.. Genetics, receptor binding property, and transmissibility in mammals of naturally isolated H9N2 Avian Influenza viruses. PLoS pathogens. 2014;10(11):e1004508. Epub 2014/11/21. doi: 10.1371/journal.ppat.1004508 ; PubMed Central PMCID: PMC4239090. - DOI - PMC - PubMed
    1. WHO. Monthly risk assessment summary. 2020. Available from: https://www.who.int/influenza/human_animal_interface/HAI_Risk_Assessment....

Publication types

Substances

Grants and funding

This work was supported by the National Key Research and Development Program (2016YFD0500204) and the National Natural Science Foundation of China (31873022, 31761133003).The funders had no role in study design, data collection and analysis, decision to publish, or preparation of the manuscript.
  NODES
INTERN 5
Note 3
Project 1
twitter 2